


Mexico
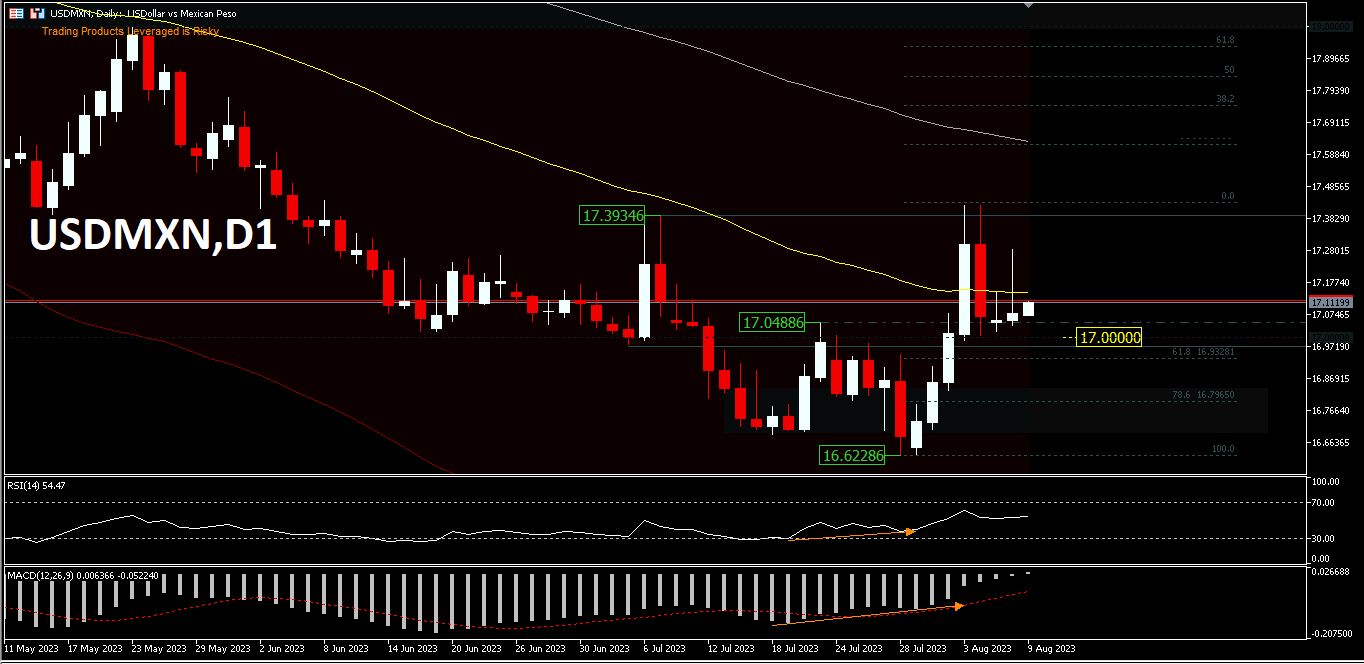
USDMXN fell back to just above $17, after failing to surpass the July peak price of $17.3934 last week on 2 attempts. Daily candles show price above the key level in a pin-bar candle format ahead of the Bank of Mexico and US July CPI reports, as well as Banxico’s rate decision due on the 11th of August. Mexico’s annual inflation rate is expected to fall for the 6th month, reaching a low of 4.7% since March 2021. The core rate will also fall to its lowest level since February 2022. As such, the Bank of Mexico is expected to keep its benchmark rate at a record 11.25% for the third time at this week’s meeting.
Despite the recent weakness, the Mexican peso is still one of the best performing currencies this year, appreciating by 12.5% due to high interest rates, political stability and the ongoing nearshoring trend. More than 60 new investments have been announced and it is estimated that the demand for nearshoring in Mexico represents 50% of the total demand in Latin America. Finance Minister Rogelio Ramirez de la O said 20 companies have announced nearshoring investments of around $13 billion, of which 54% are related to the automobile industry. Highlights are Tesla and BMW’s plans to expand operations and produce electric cars in the country.
In the previous week, the Peso faced its most challenging week driven by factors such as substantial sales of US Treasuries, concerns about the US losing its AAA rating, and the start of a monetary easing cycle by major central banks. The USDMXN pair hit an 8-year low in July ‘23 at 16.6228 (200-month EMA), and since then the pair has rallied by +4.8%, before dropping back ahead of Banxico’s inflation report and rate decision this week.
On the daily period, a divergence bias has been seen on both RSI and MACD and it looks relatively strong after surpassing the 17.0488 minor resistance. However, the price is currently holding at the 52-day EMA. A price movement above 17.3934 could be the first sign of a short-term trend change and confirm the price of 16.6228 as the yearly low to make a series of corrections to the upside for the 100-day EMA and 200-day EMA. Overall the downtrend still dominates, so it will take time and a strong catalyst to change the market perception.
On the downside, a move back below the $17 psychological mark would create a mixed outlook; so consolidation is likely inevitable and a retest of the recent low could also apply again.
Russia
Since the outbreak of the Russian-Ukrainian conflict, the ruble’s volatility against the US Dollar has intensified, at one point falling below 140 in early March last year, hitting a record low. Since then, with the Russian government taking various measures to deal with economic sanctions, the ruble exchange rate gradually recovered and reached a peak of 50 in June last year, the highest level in nearly seven years.
Since then, however, the ruble has continued to depreciate against the US Dollar. As of yesterday’s close, the ruble was down almost 90 per cent against the Dollar from its nearly seven-year high level, at around 95/96. The sharp depreciation of the ruble has been due to no less than import growth (up over 40% year-on-year), weak exports (the latest economic forecast report from the Russian Central Bank suggests that merchandise export revenues could record $414 billion this year, down almost 30% year-on-year), declining oil and gas revenues, increased demand for foreign exchange payments to non-residents, extremely low liquidity, the “Wagner” incident, etc. On top of that, from 7 August to 6 September, the Russian Finance Ministry will shift from selling to buying foreign currency within the framework of budget rules, a move that will probably put pressure on the ruble in the short term.
Most analysts are pessimistic about the ruble. Last month, the Russian Central Bank raised interest rates for the first time since September last year, raising its benchmark rate by 100 basis points to 8.5%. Russian inflation rose 3.2% year-on-year in June, compared with 2.5% previously. This is the second consecutive month that the growth rate has warmed up, while the central bank expects inflation to also reach a range of 4.5% to 6.5% by the end of this year. Higher prices and interest rates will have a further impact on consumption and ultimately pressure economic growth.
Technical Analysis:
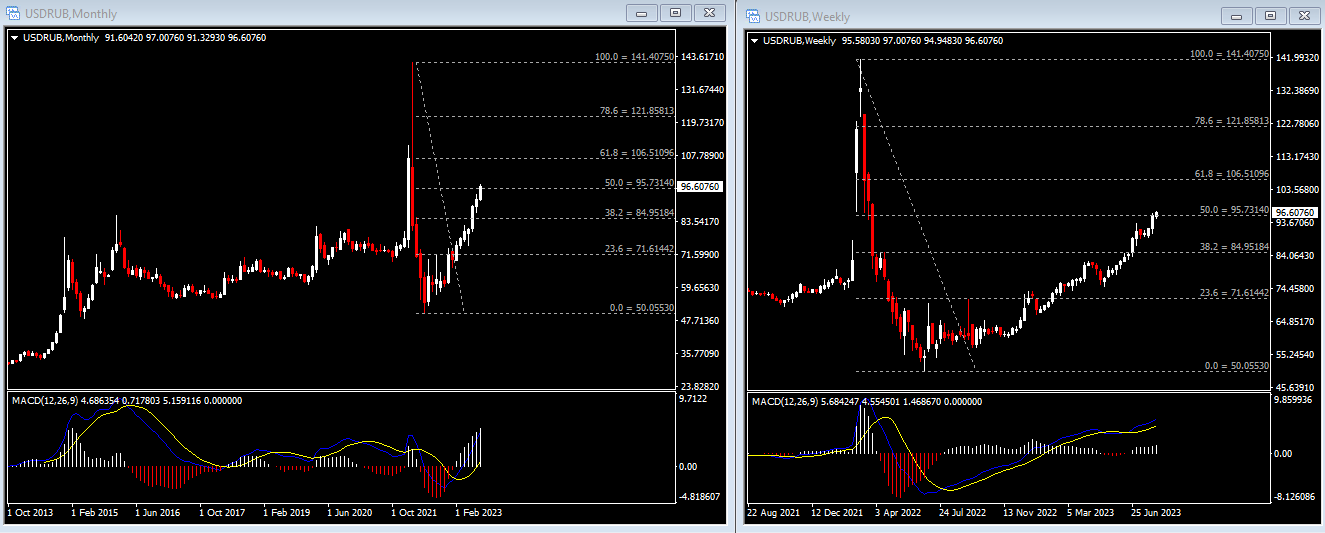
So far this year, the USDRUB has ended every month except January on a bullish monthly basis. Moving into August, the bullish momentum seems to be showing no signs of fading and is now testing the 95/96 key level (50.0% of the FR stretching from the peak in March last year to the low in June of the same year). A break above this key point signals a continuation of the uptrend and even has the potential to develop into a medium to long term bullish trend. The MACD remains in a positive configuration.
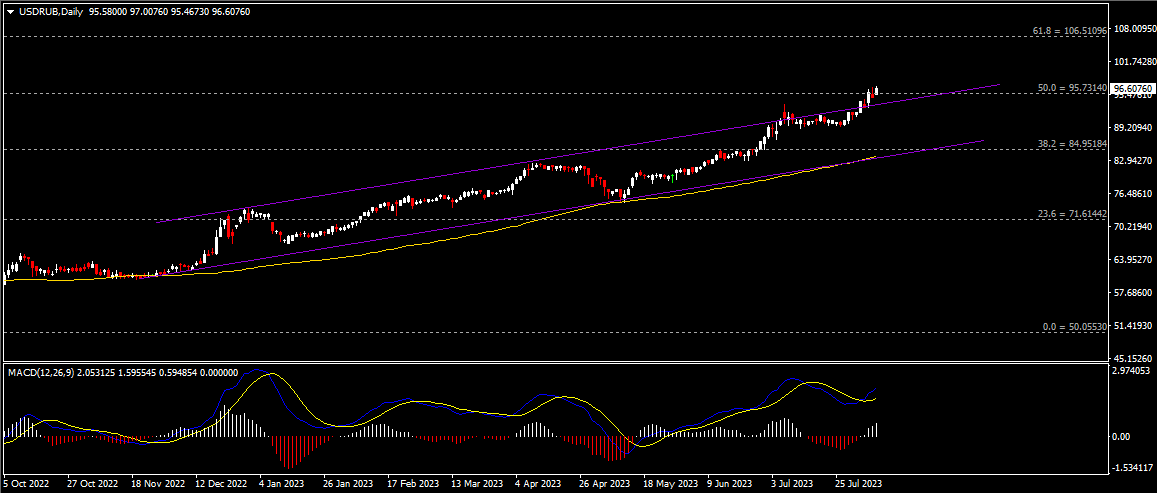
The daily chart shows that the USDRUB has been trading above the 100-day SMA since last October and has recently broken the shackles of the uptrend channel. Therefore, if the bulls manage to break through the recent resistance, the next points to watch will be the psychological level of 100 and then 106.50 (FR 61.8%). Any retracement will signal a false breakout of the channel and the currency pair will return to trading within the channel. The bottom of the channel will be near-term support, followed by 85 (FR 38.2%) and the 100-day SMA.
Click here to access our Economic Calendar
Ady Phangestu & Larince Zhang
Market Analysts
Disclaimer: This material is provided as a general marketing communication for information purposes only and does not constitute an independent investment research. Nothing in this communication contains, or should be considered as containing, an investment advice or an investment recommendation or a solicitation for the purpose of buying or selling of any financial instrument. All information provided is gathered from reputable sources and any information containing an indication of past performance is not a guarantee or reliable indicator of future performance. Users acknowledge that any investment in Leveraged Products is characterized by a certain degree of uncertainty and that any investment of this nature involves a high level of risk for which the users are solely responsible and liable. We assume no liability for any loss arising from any investment made based on the information provided in this communication. This communication must not be reproduced or further distributed without our prior written permission.


