Workday, Inc is a cloud-based software provider specialising in financial management, enterprise resource planning (ERP) and human capital management (HCM) applications and is a pioneer in human resources software-as-a-service (SaaS). The company was founded in 2005, in Pleasanton, California, USA and has a market capitalisation of $59.31B. The company is expected to report its third quarter 2023 earnings on Thursday, 24/08/2023 after the market closes.
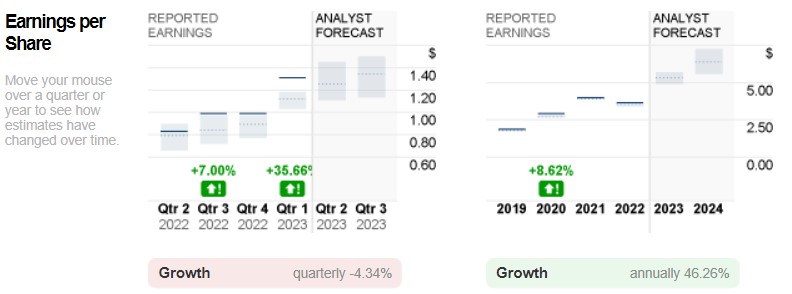
Zacks ranks Workday “Rank #1 – Strong Buy” in the Top 36% at #91/252 in the Internet-Software industry. For this report we expect EPS of $1.25 (same as CNNBusiness but for Nasdaq a big difference at $0.12) which would be up 50.60% YoY from the $0.83 reported for the same period last year, while this quarter it has a 1.82% ESP.
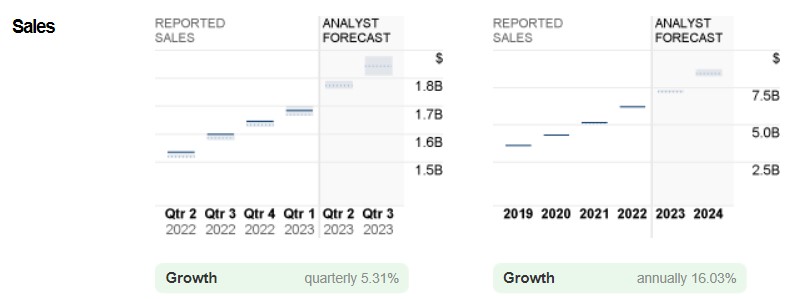
Expected profit of $1.77B which would be a 15.47% y/y growth from last year’s $1.54B. The company has a P/E ratio of 42.72 and a PEG ratio of 1.73. The estimate has had no upward or downward revisions in the last 60 days.
The company has had mostly positive results in recent quarters, last quarter with an EPS surprise of 18.02%, the last negative was in May 2022 with an EPS surprise of -3.49%. Last quarter the company reported EPS of $1.31 and revenue of $1.7B.
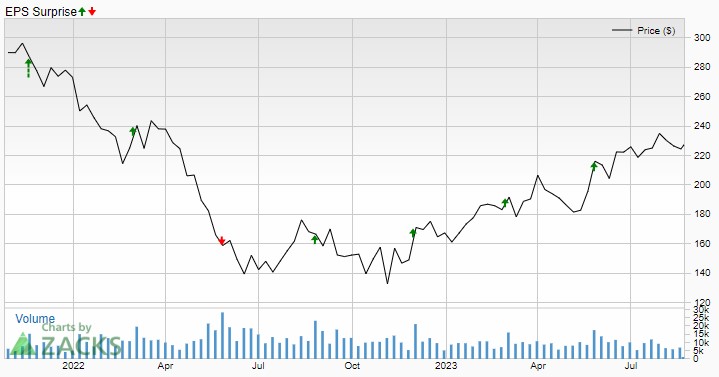
Regarding Workday‘s stock price forecast for the next 12 months, the lowest forecast is a -37.8% decline at $142.00, the highest expectation is a +27.1% increase at $290.00, while the average price is found at +9.5% at $250.00. For marketbeat the target price is $234.47.
To expand the functionality of its Workday Adaptive Planning software, Workday announced the launch of next-generation Elastic Hypercube Technology (“EHT”) during the second fiscal quarter. The software solution, which integrates AI and ML at its core, provides a range of features to help businesses with labour, operational and financial planning.
The upgraded EHT enables accelerated data integration, which will streamline the import and export of significant amounts of financial and non-financial data for complete and accurate models. Its sophisticated AI makes complex model calculations more efficient and ensures dynamic and automatic scaling. As a result, the quarter is likely to have seen an increase in revenues.
To enhance and streamline its workforce planning capabilities, Mondelez, a leading snack food supplier with a presence in 82 countries and more than 90k employees, integrated Workday Adaptive Planning during the quarter to improve workforce visibility with advanced capabilities.
Boeing, a leading aircraft manufacturer and designer, has also used Workday solutions to standardise processes, improve visibility, generate cost savings, and drive operational efficiencies. These changes and collaborations are likely to have had a positive impact on this quarter’s results.
Estimated subscription services revenue is $1,612.3M, up 17.9% YoY, professional services revenue is estimated at $160.1M.
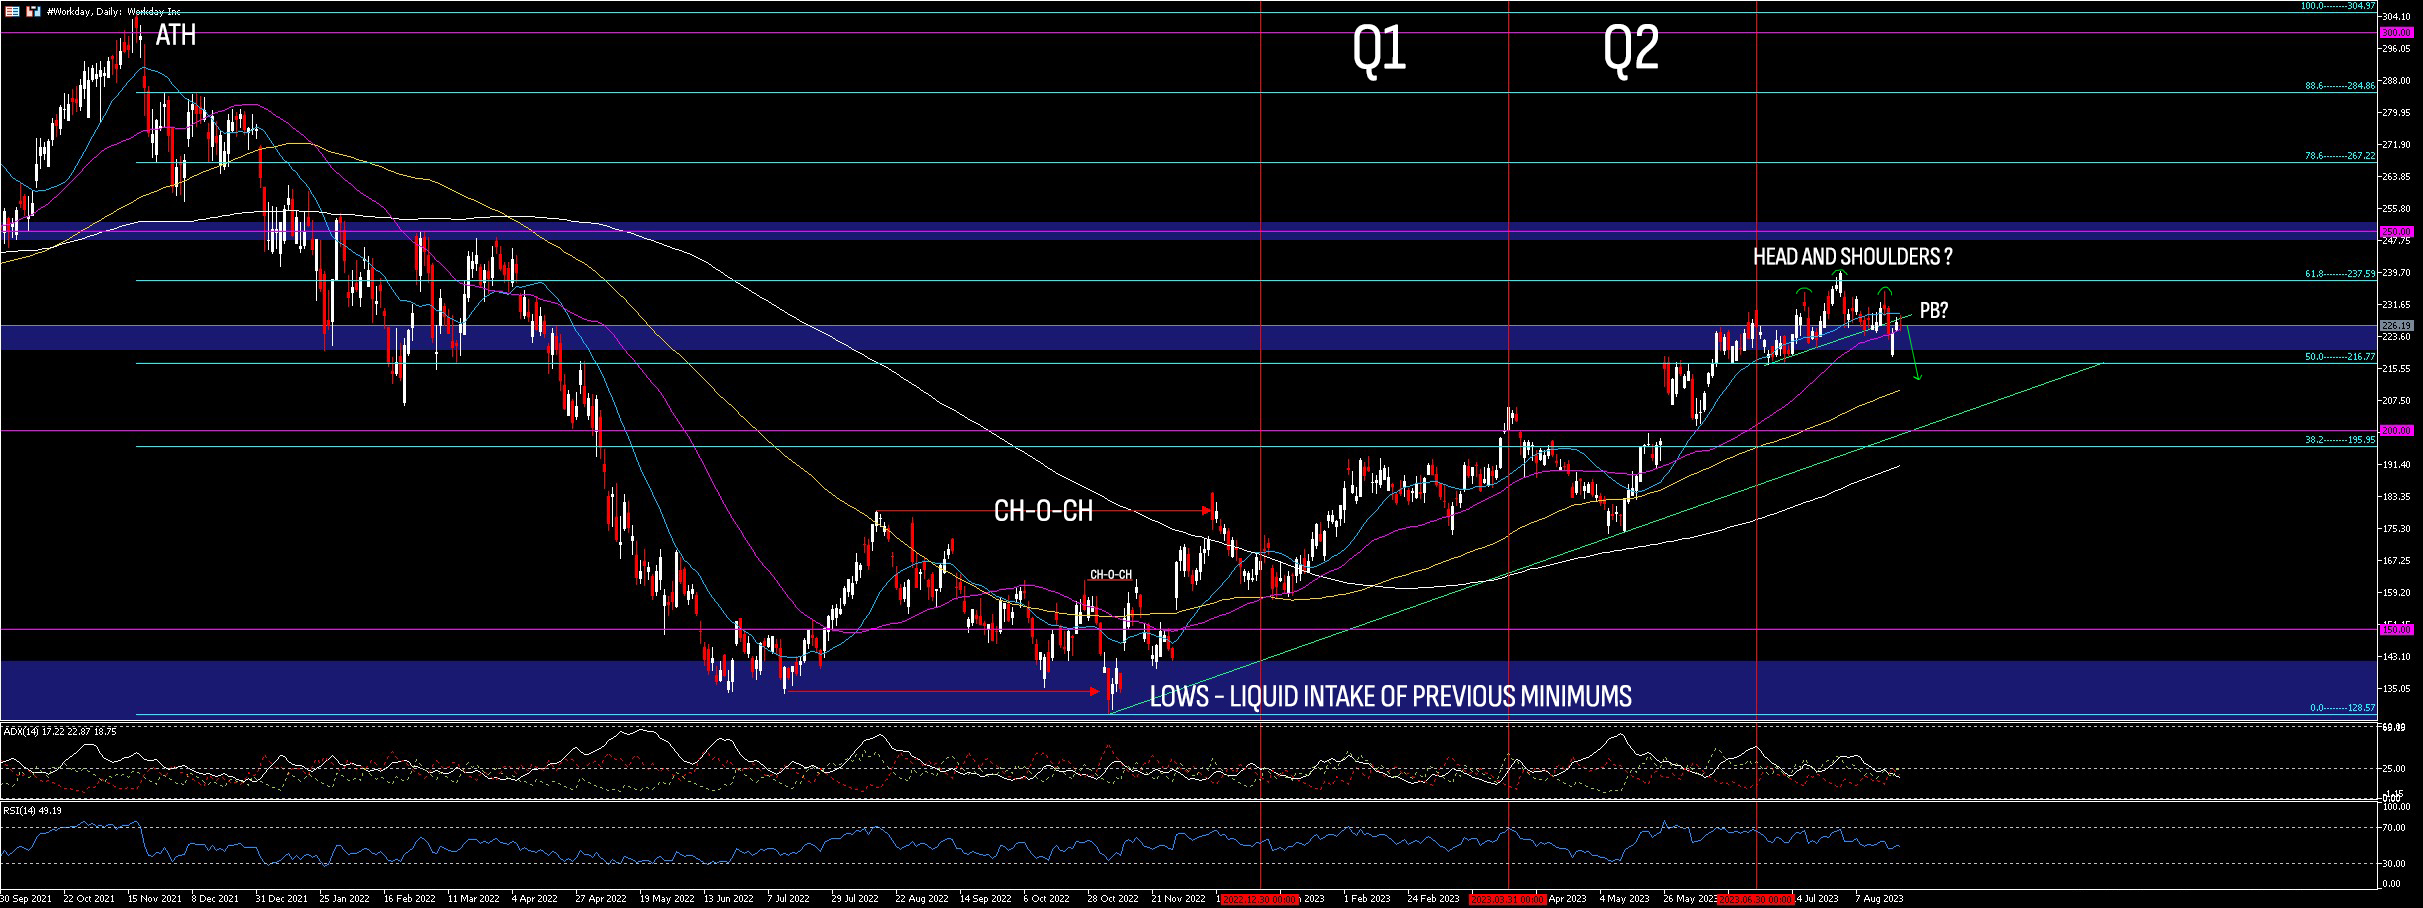
Technical Analysis – Workday D1 – $226.37
All-time high: $304.97 (November 2021)
Current low: $128.57 (November 2022)
In the first quarter Workday rose 30.85% from a low of $157.85 to a high of $206.68 closing the quarter above the psychological $200.00 level. This second quarter the price pulled back to the $174.25 level and from there it rallied 32.35% to a high of $230.62, closing the half year just below this level.
So far this quarter the price has been in a range between $216.79-$240.18 awaiting results and stopped by the 61.8% Fibo at $237.59 although it seems to be forming a small “shoulder head shoulder” pattern.
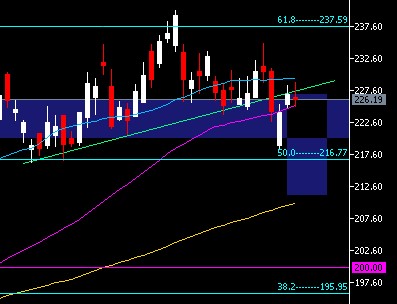
With a target at the daily 100 period SMA at $209.90, as the collarbone has already been broken, it would be in pullback but still range bound.
The next highs in case of positive results and overcoming the 61.8% Fibo are at the psychological level of $250.0 and then up to the 88.6% Fibo highs at $284.86 to the ATH at $304.97.
ADX at 17.22 with no confirmed trend but with the +DI at 22.87 overcoming the -DI at 18.75. RSI at 49.19 neutral through the range. Price is between the daily 20-period SMA at $229.381 and the daily 50-period SMA at $225.169 testing this same day.
Click here to access our Economic Calendar
Aldo Zapien
Market Analyst – Educational Office HFM Latam
Disclaimer: This material is provided as a general marketing communication for information purposes only and does not constitute an independent investment research. Nothing in this communication contains, or should be considered as containing, an investment advice or an investment recommendation or a solicitation for the purpose of buying or selling of any financial instrument. All information provided is gathered from reputable sources and any information containing an indication of past performance is not a guarantee or reliable indicator of future performance. Users acknowledge that any investment in Leveraged Products is characterized by a certain degree of uncertainty and that any investment of this nature involves a high level of risk for which the users are solely responsible and liable. We assume no liability for any loss arising from any investment made based on the information provided in this communication. This communication must not be reproduced or further distributed without our prior written permission.


