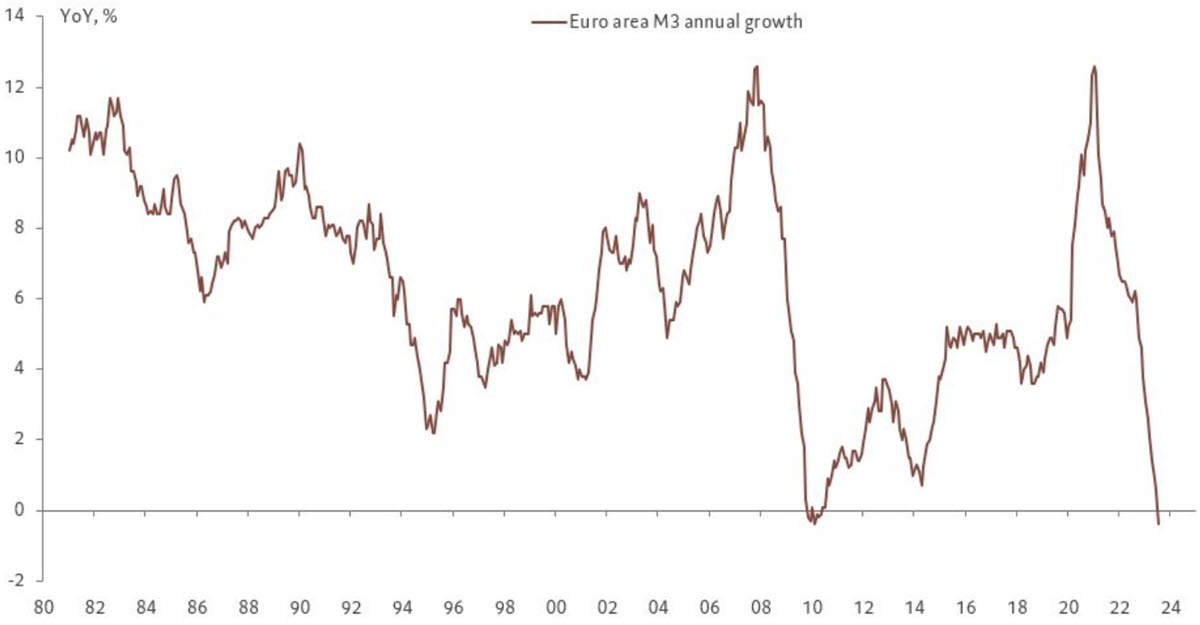
That the Eurozone is not in good shape economically we know and we have said it many times: manufacturing, orders, PMIs, hours worked (in Germany they reached the lowest since the data started being collected in 1971, 34.3 hours per week on average). Yesterday, two other pieces of data came out, important although generally not so closely watched by retail traders, relating to monetary growth. The M1 aggregate (currency, checking accounts, demand deposits and other liquid deposits) has been contracting since late 2022 but finally the July data showed that the broader M3 aggregate (which includes all forms of saving deposits, time deposits and money market funds) also contracted for the first time in 13 years (the last time was in 2010, after the GFC). The shift from overnight deposits to longer-term deposits was a major factor, but there it is. Why does this matter? Because money supply is the oil that drives the economic engine.
And another bad sign came from the growth of credit through private loans: +1.3% y/y to the lowest level since 2016. Banks at some point last spring halted lending as easily as before, both to individuals and to companies, halting the expansion of their balance sheet.
How are European stock indices doing in all this? Not too bad, trading around 2% to 4% off their recent highs, which in some cases are also all-time highs (as in the case of the GER40 and FRA40). In fact, comparing 1-year performance against their US peers, the continental indices are doing much better (GER40 +21.75% vs US30 +7.05%) and even reducing the time frame to the month of August only, the Spanish IBEX would be on the run (-1.57% against -4.46% of US100 and -3.40% of the US500).
Comparison of the performance of US and EU indices
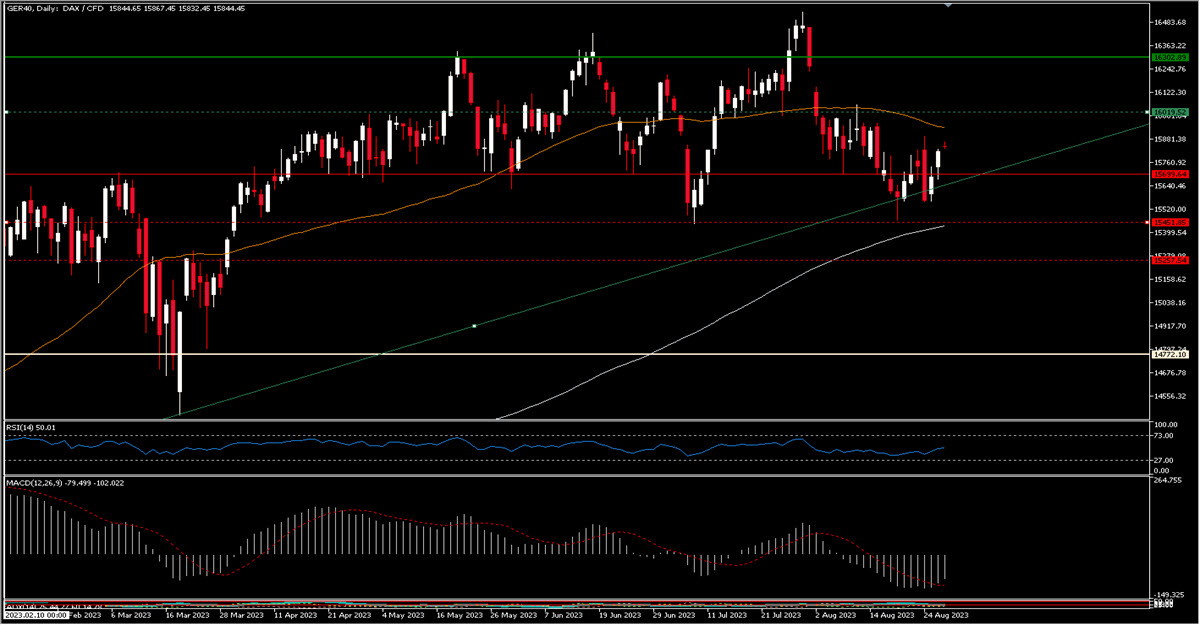
Looking at the charts, we notice vaguely similar behaviour among the 3 main European indices we offer: all have lost the strong bullish momentum that started in October 2022 and have slowed down moving practically sideways since April this year. In the case of GER40 there is a real range with 15450, 15700 as important levels downwards and 16000, 16300 upwards.
GER40, Daily
SPA35 seems to be the strongest of the three benchmarks as it is moving in a slightly bullish channel which nowadays would have its lower bound at 9230 and upper one at 9730 (which is also the recent high and a key level before the Covid crisis-related collapse).
SPA35, Daily
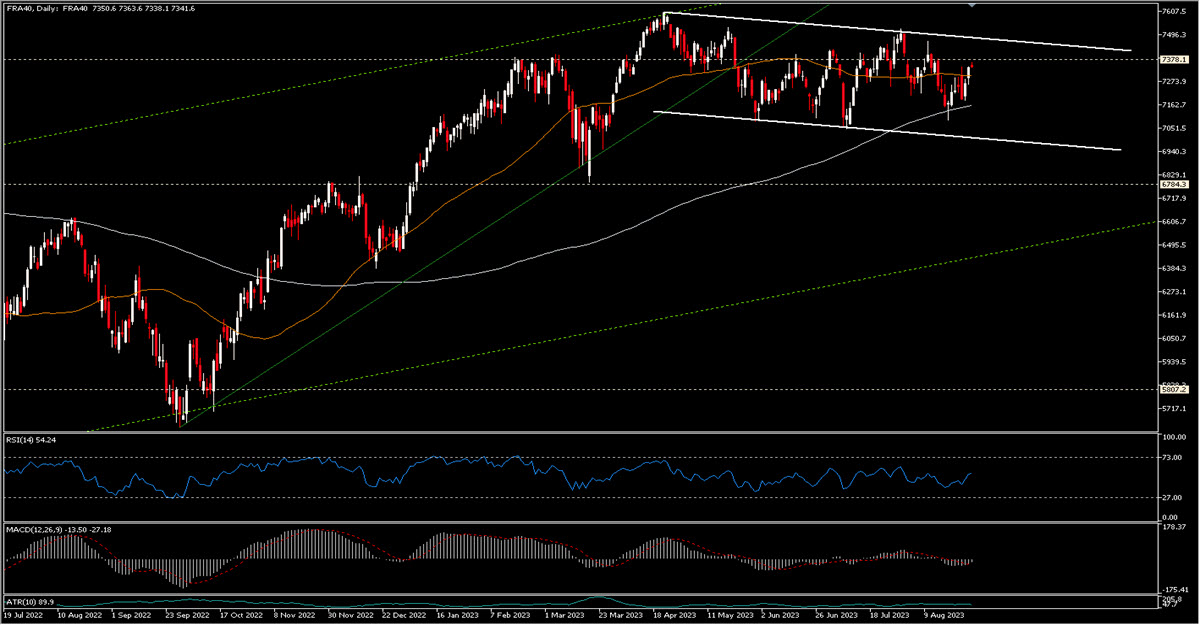
On the other hand, the French FRA40 shows descending highs and lows but still within a channel (upper limit at 7475, lower in the 7000 area to date).
FRA40, Daily
And this is actually what makes the European indices interesting, a rather stable and defined behaviour during the last 4 months or so, with clear reference points to follow. Until they are broken, of course.
Click here to access our Economic Calendar
Marco Turatti
Market Analyst
Disclaimer: This material is provided as a general marketing communication for information purposes only and does not constitute an independent investment research. Nothing in this communication contains, or should be considered as containing, an investment advice or an investment recommendation or a solicitation for the purpose of buying or selling of any financial instrument. All information provided is gathered from reputable sources and any information containing an indication of past performance is not a guarantee or reliable indicator of future performance. Users acknowledge that any investment in Leveraged Products is characterized by a certain degree of uncertainty and that any investment of this nature involves a high level of risk for which the users are solely responsible and liable. We assume no liability for any loss arising from any investment made based on the information provided in this communication. This communication must not be reproduced or further distributed without our prior written permission.


