


Stock Indices posted modest declines, with the USA500 and USA100 recording 1-week lows and the USA30 recording a 1-½ week low. Rising yields were negative for the indices.
Bond yields surged after the August ISM services report released on Wednesday increased more than forecast, strengthening speculation that the Fed will keep interest rates higher for a longer time. The US ISM services index in August unexpectedly rose +1.8 to a 6-month high of 54.5, stronger than expectations of a decline to 52.5.
The US trade deficit in July widened to -$65.0 billion from -$63.7 billion in June, a smaller deficit than the -$68.0 billion forecast. Losses on Wall Street’s major stock indices eased at Wednesday’s close, following the release of the Federal Reserve’s Beige Book. The report revealed that economic growth in most regions of the United States was “modest” in July and August. Meanwhile, concerns over the future of the central bank’s monetary policy remained in focus.
Stock markets in Asia-Pacific were lower today, as negative sentiment regarding interest rates seemed to spread from the United States. The JPN225 fell 0.25%, the Shanghai Composite fell 0.34%, the Shenzhen Composite Index fell 0.85%, and the Hang Seng fell 0.93%. Kospi lost 0.82%. The AUS200 had lost 1.11% at the time of writing.
Technical Review
At first glance, JPN225 was seen forming a parabolic curve pattern, a pattern which develops during a strong bullish trend and is a bearish reversal indicator triggered by buyer exhaustion. The former connects the lows created by a series of market pullbacks to build the formation. As a result, the pattern visually depicts an upward-sloping curve.
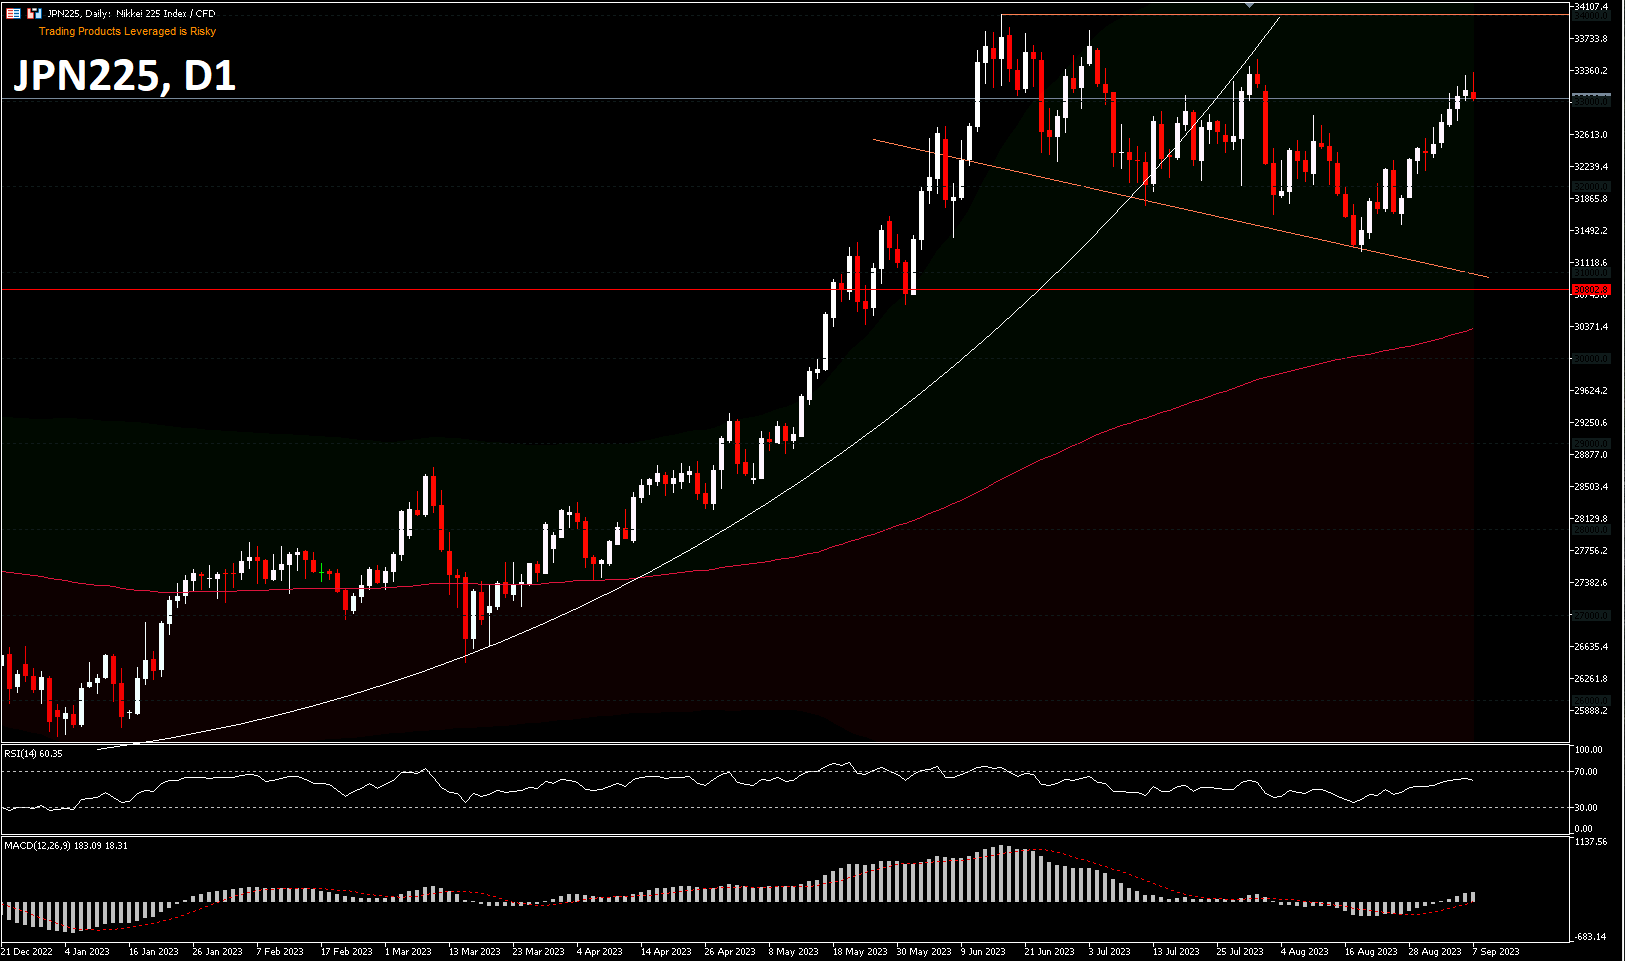
The #JPN225 registered a new peak in June at 34,012, after a rebound of 24,498 managed to break the key resistance of 30,802 last May. The price of this index seems to have stalled at the 34,012 peak. Since then it seems to be consolidating in a downward trajectory and recorded a 2-month low of 31,244 in August. The rise from 31,244 seems to have started encountering resistance near the lower high of 33,484 by presenting a daily shooting star candle pattern. Nonetheless, technical indications from RSI are yet to show overbought and MACD is still configured in the positive area. On the downside, the index could test the 20-day EMA near September’s opening price of 32,512. Key support remains at 30,802 resistance which is now support above the 200-day EMA.
Click here to access our Economic Calendar
Ady Phangestu
Market Analyst – HF Educational Office – Indonesia
Disclaimer: This material is provided as a general marketing communication for information purposes only and does not constitute an independent investment research. Nothing in this communication contains, or should be considered as containing, an investment advice or an investment recommendation or a solicitation for the purpose of buying or selling of any financial instrument. All information provided is gathered from reputable sources and any information containing an indication of past performance is not a guarantee or reliable indicator of future performance. Users acknowledge that any investment in Leveraged Products is characterized by a certain degree of uncertainty and that any investment of this nature involves a high level of risk for which the users are solely responsible and liable. We assume no liability for any loss arising from any investment made based on the information provided in this communication. This communication must not be reproduced or further distributed without our prior written permission.


