


You may have already seen this chart: it represents the seasonality of the fear index, the VIX, from 1990 until last year (in dark grey). There is also a line (light grey) that does the same thing, but excludes 2008, which was a particularly volatile year due to the GFC and therefore an outlier.
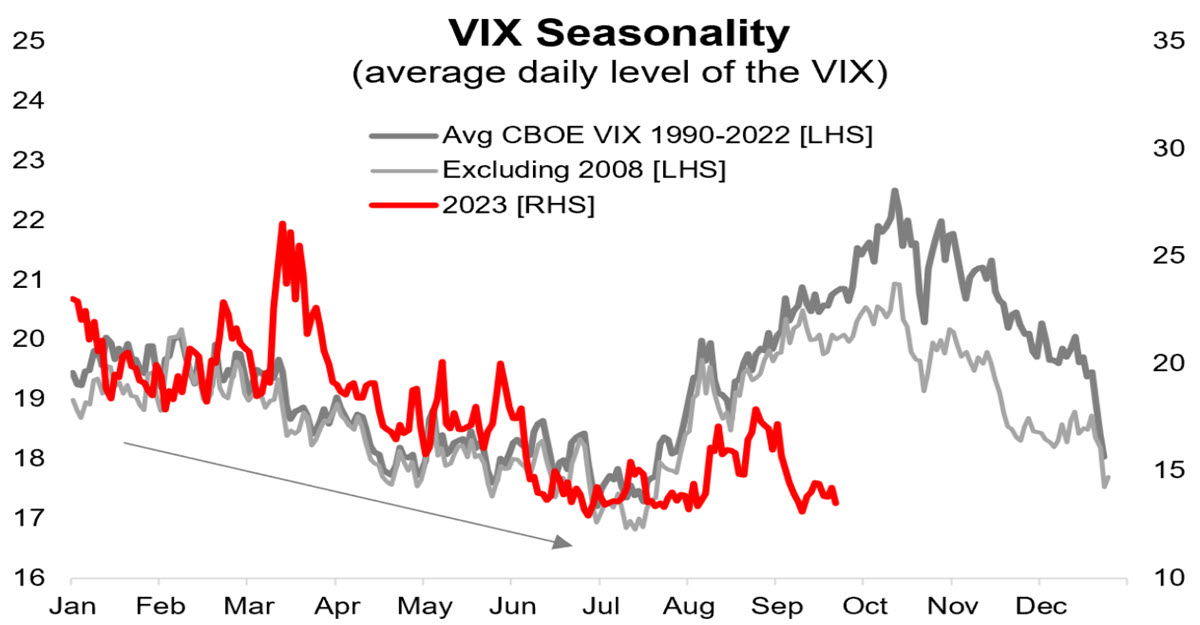
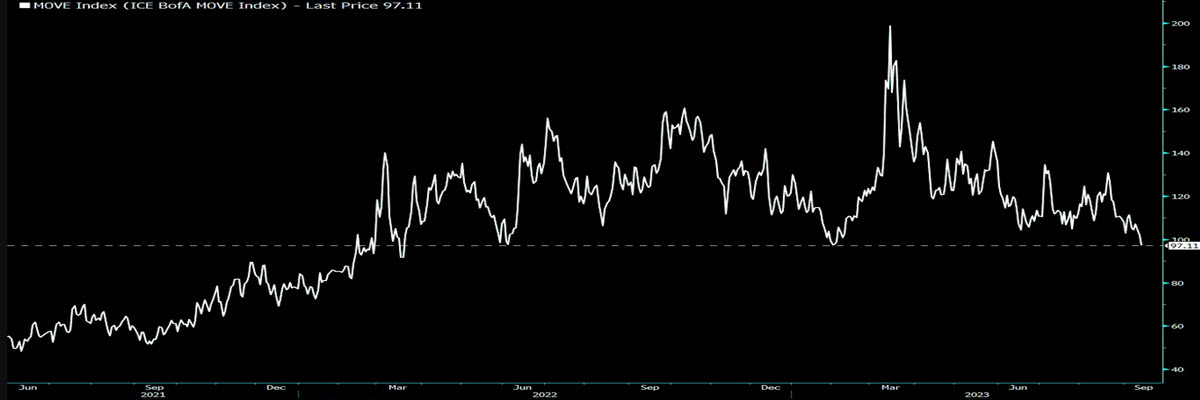
This chart has been around for at least a couple of months, since July, when statistically the VIX starts to rise as a prelude to a not particularly favourable time of year (we analysed September’s seasonality a few days ago). However, this year is going in a completely different direction, for now: yesterday the volatility index closed at 13.88, the second lowest level after the 13.22 recorded in mid-July and once again below the pre covid levels (which at one point seemed to have been overcome, as if there were a new regime of greater price dispersion). The interesting thing is that this is not even the only case- generally the volatility of all assets is close to the lows of the last two years: a few days ago MOVE, the bond volatility index, reached the lowest level since March 2022; the next chart is a Cross Asset Volatility index comprising Equity, Fixed Income, Currencies, Oil and High Yield Credit, which is also close to 18-month lows. In short, we are in a situation which – despite inflation and monetary policy – seems to benefit Buy and Hold investors and those using Carry Trade strategies given the basic stability of the environment.
(a) BOFAML, MOVE Index, (b) Cross Asset Volatility
 Certainly, applying technical analysis to the VIX chart one can see that the price of implied volatility is low and very close to a previous bottom. But it seems that volatility selling strategies are becoming more and more popular in this market which is also flooded with 0dte options. This means selling options (volatility) to earn a premium, a kind of yield. They are widely used by electronic market makers, who are among the main players in providing liquidity to indices (and hedge with options). Of course, the shock could come from a sudden unfolding of these highly concentrated strategies, but this usually happens after specific levels have been broken.
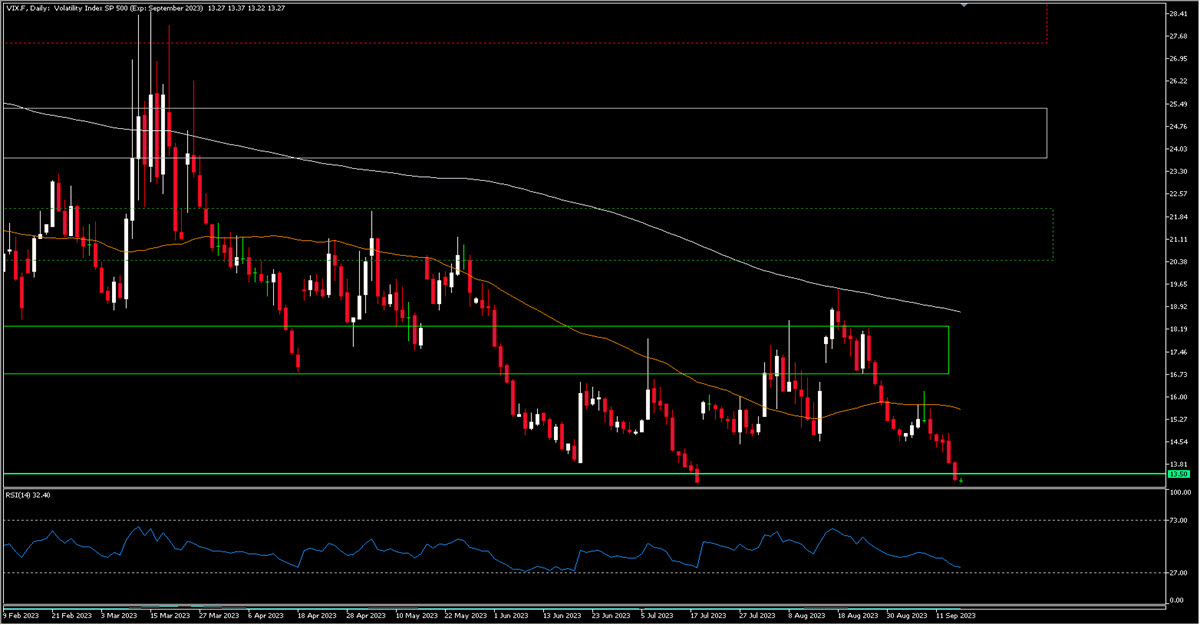
13.22 was the low at the beginning of July and can be used as a trading reference, as a stop level (be it stop loss – get out of the order – or stop order – enter it). One thing to remember is the asymmetrical behavior of the VIX: it falls slowly and rises explosively. Downwards it is almost in unchartered territory, given the levels of recent years, upwards 14.75, 15.60, 16.10 and 16.60 are the levels to watch.
Click here to access our Economic Calendar
Marco Turatti
Market Analyst
Disclaimer: This material is provided as a general marketing communication for information purposes only and does not constitute an independent investment research. Nothing in this communication contains, or should be considered as containing, an investment advice or an investment recommendation or a solicitation for the purpose of buying or selling of any financial instrument. All information provided is gathered from reputable sources and any information containing an indication of past performance is not a guarantee or reliable indicator of future performance. Users acknowledge that any investment in Leveraged Products is characterized by a certain degree of uncertainty and that any investment of this nature involves a high level of risk for which the users are solely responsible and liable. We assume no liability for any loss arising from any investment made based on the information provided in this communication. This communication must not be reproduced or further distributed without our prior written permission.


