#Nvidia shares fell in trading 2 weeks ago, due to concerns that US trade restrictions against China will severely hamper sales. The restrictions on sales of advanced chips to China are part of the Biden administration’s efforts to keep AI technology out of the hands of the Chinese military. In addition, competitor Advanced Micro Devices (AMD) plans to take a bit of Nvidia’s AI sales with its MI300 AI accelerator, which will be available on December 6.
The company develops the A100 and H100 series of graphics processing units (“GPUs”), which are used by software companies to power their artificial intelligence (AI) applications. Nvidia enjoys high pricing power, as the lack of competitors leaves customers with no choice but to accept the set price.
The Santa Clara, California-based company plans to report its earnings results for the fiscal quarter ended October 29, after market close on November 21. Analysts surveyed by FactSet expect Nvidia to earn $3.33 per share on $16.06 billion in sales. Nvidia earned 58 cents per share on sales of $5.93 billion in the previous quarter.
This year, demand for graphics processors and data center hardware for artificial intelligence applications has driven Nvidia’s huge sales and earnings growth. In a weekend note to its clients, investment firm Evercore ISI called Nvidia arguably the most important stock in the world today.
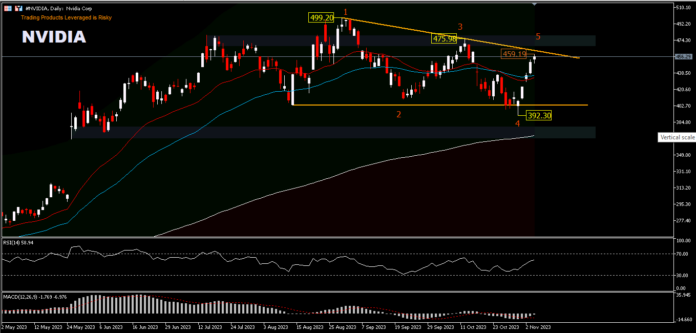
On Monday [06/11] #Nvidia shares rose more than 1% to record a daily high of 459.19 before declining to a range of 456.00 at the time of writing. This is an extension of last week’s gains which were almost 10% higher. #Nvidia stock has formed a head and shoulder base before, but it looks like this bearish reversal pattern has been canceled, after last week’s strong gains. The positive news for the stock is that #Nvidia has risen above the 26- and 50-day exponential moving average lines.
But there are some warning signs for Nvidia stock. First, the price has reached resistance at the downward-sloping trend line from the 499.20 and 475.98 drawdowns. And the current chart pattern resembles more of a descending triangle pattern. A move higher would test 475.98; then the 499.20 peak. While on the downside, the 392.30 support will favor the bull brush trying to defend the price.
Click here to access our Economic Calendar
Ady Phangestu
Market Analyst – HF Educational Office – Indonesia
Disclaimer: This material is provided as a general marketing communication for information purposes only and does not constitute an independent investment research. Nothing in this communication contains, or should be considered as containing, an investment advice or an investment recommendation or a solicitation for the purpose of buying or selling of any financial instrument. All information provided is gathered from reputable sources and any information containing an indication of past performance is not a guarantee or reliable indicator of future performance. Users acknowledge that any investment in Leveraged Products is characterized by a certain degree of uncertainty and that any investment of this nature involves a high level of risk for which the users are solely responsible and liable. We assume no liability for any loss arising from any investment made based on the information provided in this communication. This communication must not be reproduced or further distributed without our prior written permission.


