Nvidia Corp. started on a path higher in November, since gaining ground at $395.09 in 31st October. As of market close last Friday, Nvidia recorded gains of over 24% from its recent lows. The American multinational technology company which engages in the design and manufacture of computer graphics processors, chipsets and related multimedia software, shall release its Q3 2023 earnings report on 21st November (Tuesday), after market close.
The company has been in the realm of $1T in market cap for over 5 months. Optimistic expectations in the field of AI have driven the growth of related companies, with Nvidia being one of the biggest beneficiaries. According to Wedbush analyst Dan Ives, “We view AI as the most transformative technology trend since the start of the Internet in 1995… many on Wall Street underestimate the $1 trillion of AI spend set to happen over the next decade in a bonanza for the chip and software sectors.“
Last Monday, Nvidia introduced a new graphic processing chip – the H200. The chip includes 141GB of next generation “HBM3” memory, with output speed nearly twice as fast as its current model H100. This promises significant improvements over the previous version, in assisting AI models to generate text, images or predictions at better efficiency. The H200 is also compatible with H100, which means the AI companies that have already implemented previous model for training will not need to change their server system or software to use the latest version.
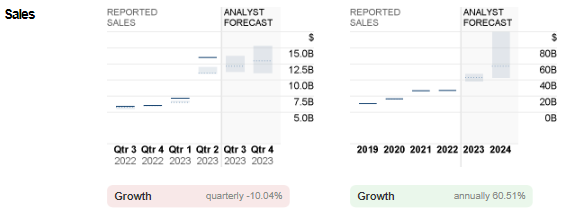
Nvidia: Revenues & Earnings (After Deduction of Tax and Expenses). Source: Tipranks
The latest revenue reported by Nvidia hit $13.51B, up a whopping 88% and 101%, from Q1 2023 and the prior year period, respectively. Operating income was up 155% (q/q) and up 487% (y/y), to $7.78B. Gross margin was also up 4.4 points quarterly and up 25.3 points from the same period last year, to 71.2%.
In general, the Data Center segment continued to drive most of the gains, thanks to surging demand for AI chips and relevant products. In Q2 2023, it recorded sales revenue worth $10.32B, up 141% from the previous quarter, and up 171% from year ago. Sales revenue in the Gaming segment was up 11% (q/q) and 22% (y/y) respectively, to $2.49B. On the other hand, Professional Visualization recorded revenue up 28% (q/q) to $379 million, but down 24% from the prior year period. Lastly, Automotive did not perform well quarterly, down 15% to $253 million. The segment was still up 15% from the same period last year.
It is worth noting that Nvidia has recently announced its partnership with Hon Hai on “AI factories”. The latter, best known as the maker of Apple Inc.’s iPhone, made its attempt to pivot into automobiles following stagnated growth in the consumer electronics market. Via the AI facilities provided by Nvidia, Hon Hai expressed its ambition not restricted to only EVs, but also in other industries such as smart manufacturing and robotics.
Besides the ongoing macroeconomic uncertainties, other headwinds include Microsoft, another IT conglomerate which announced its first launch of custom chip for cloud AI recently, which has been viewed as an alternative to Nvidia chips. In addition to existing competitors such as Advanced Micro Devices and Intel, some other major companies like Alphabet and Amazon are also joining the race (where both have launched their own AI accelerator).
Nvidia: Reported Sales versus Analyst Forecast. Source: CNN Business
In the coming announcement, consensus estimates for sales of Nvidia stood at $12.2B, slightly down -9.6% from the previous quarter, but still doubled from the same period last year. In contrast, the management’s outlook is slightly more optimistic, at $16B (+/-2%).
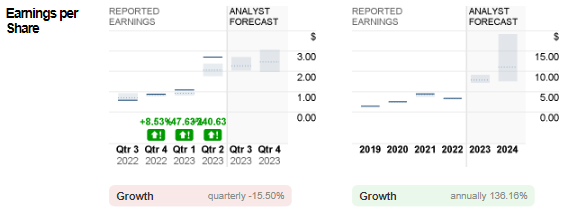
Nvidia: Reported EPS versus Analyst Forecast. Source: CNN Business
On the other hand, EPS is expected to hit $2.28, below the previous quarter’s $2.70. In Q3 2022, it was $0.58.
Technical Analysis:
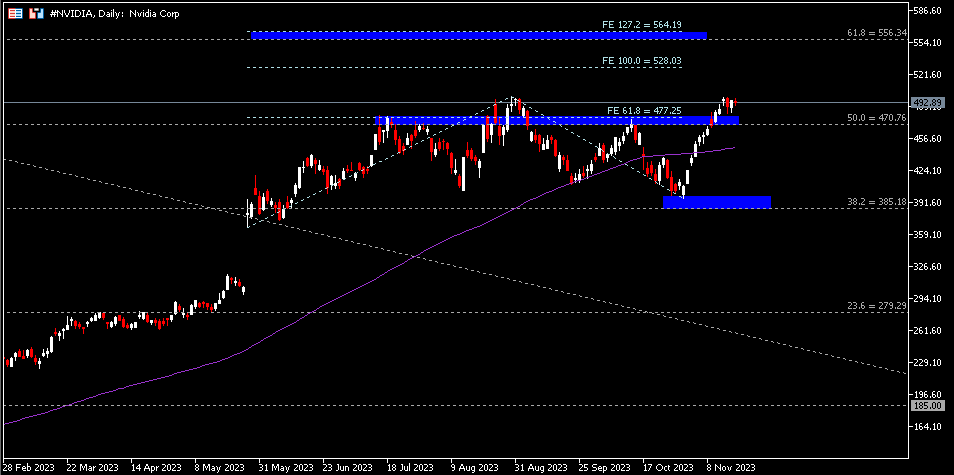
The #NVIDIA share price has formed a head and shoulder chart pattern since mid July to mid October. Lately, the asset price remains above the R-shoulder, but closed below the head which saw its highest at $499.20. This would serve as the nearest resistance, as a bullish breakout above this level may encourage the bulls to continue testing $528, a level projected via Fibonacci Expansion, followed by $556-$564 resistance zone. On the other hand, a close below support zone $470.80-$477.30 may indicate technical correction, with 100-week SMA serving as dynamic support.
Click here to access our Economic Calendar
Larince Zhang
Market Analyst
Disclaimer: This material is provided as a general marketing communication for information purposes only and does not constitute an independent investment research. Nothing in this communication contains, or should be considered as containing, an investment advice or an investment recommendation or a solicitation for the purpose of buying or selling of any financial instrument. All information provided is gathered from reputable sources and any information containing an indication of past performance is not a guarantee or reliable indicator of future performance. Users acknowledge that any investment in Leveraged Products is characterized by a certain degree of uncertainty and that any investment of this nature involves a high level of risk for which the users are solely responsible and liable. We assume no liability for any loss arising from any investment made based on the information provided in this communication. This communication must not be reproduced or further distributed without our prior written permission.


