


America’s bank conglomerates – JPMorgan and Citigroup – shall deliver their Q4 2023 earnings result this Friday (12h January) before market open.

Last year, the Dow Jones US Banks Index was seen falling behind the S&P500 since early March, primarily triggered by the failure of a list of domestic banks. The index gained ground in the last quarter of the year, closing the year at an annual return of 5.61%, in contrast to 23.03% generated by the S&P500, mainly boosted by outstanding performance of mega-cap technology stocks (with the Magnificent Seven contributing nearly half of the overall gains), increased expectation for the shift in Fed policy in near term and the hopes of soft landing. For the banking sector, higher borrowing cost helped to boost interest income for the big lenders. Moving forward, a rate cut may alleviate borrowers’ pressure, while improved capital levels may also be enough to regain investors.
JPMorgan
JPMorgan is the world’s largest bank by market capitalization (over $495B). It offers a range of financial and investment banking services and products in all capital markets, including advising on corporate strategy and structure, capital raising in equity and debt markets, risk management, market making in cash securities and derivative instruments, brokerage and research.
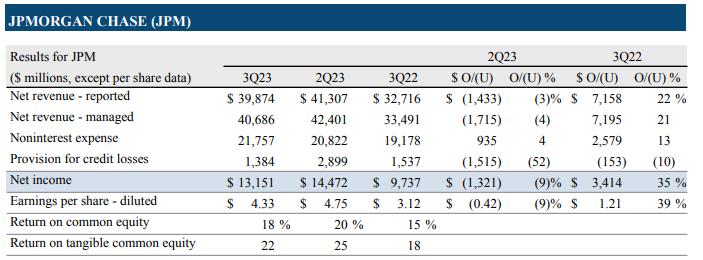
In Q3 2023, JPMorgan delivered $40.7B in net revenue, down -4% from the previous quarter, but up over 21% from the prior year period. Excluding First Republic, net income was $13.2B, down -9% from the previous quarter, but up 35% from the same period last year.
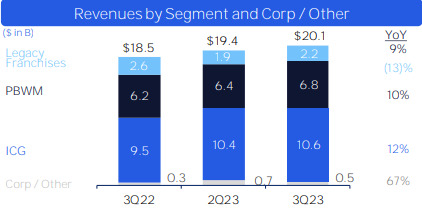
By business segment, Consumer & Community Banking contributed the most to the banks’ revenue ($18.4B, with continuous improvement in Banking and Wealth Management, Home Lending, Card Services and Auto and provision for credit losses, slightly offset by an increase in non interest expense), followed by Corporate & Investment Banking ($11.7B, with revenue of both banking and markets & securities services down -2%), Asset & Wealth Management ($5B, relatively flat following higher management fees and higher average market levels, offset by lower performance fees and lower net interest income), Commercial Banking ($4.03B, driven by higher net interest income, partially offset by lower balances, as well as increase in non-interest expense), and finally Corporate ($1.6B).
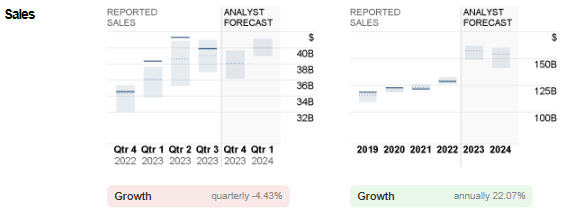
Consensus estimates for JPMorgan sales in the upcoming announcement stood at $38.1B. If reported figures hit expectations, this could bring the total sales revenue of FY 2023 to $157.1B, up over 22% from the previous year.
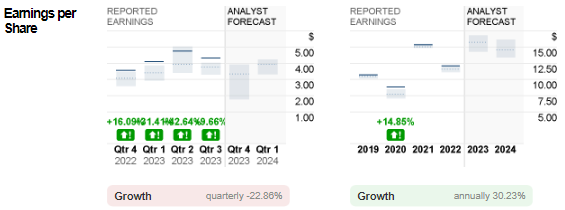
EPS, on the other hand, is expected to hit $3.34, down nearly -23% from the previous quarter. It was $3.57 in the fourth quarter last year. Analysts forecast the final EPS for FY 2023 to reach $15.75, up over 30% from the previous year.
Citigroup
Citigroup, formed by the merger of banking giant Citicorp and financial conglomerate Travelers Group in 1998, has a market capitalization over $102B. It operates through Global Consumer Banking (traditional banking services for retail customers), Institutional Clients Group (fixed income and equity research, sales and trading, foreign exchange, prime brokerage, derivative services, investment banking and advisory services, private banking, trade finance and securities services), and Corporate and Other (include un-allocated costs of global staff functions, other corporate expenses, un-allocated global operations and technology expenses).
In Q3 2023, Citigroup bagged $20.1B in sales revenue, up 4% from the previous quarter, and up 9% from the same period last year. Within Personal Banking and Wealth Management (PBWM), its US Personal Banking segment achieved double digit revenue growth (y/y) for the fifth consecutive quarter, while the Wealth segment was up 2% (y/y) in revenue supported by robust underlying business drivers. Also, its Institutional Clients Group (ICG) segment delivered satisfying results, with Services recording its highest revenue quarter in the last decade, Markets achieving the best quarter in last decade in terms of rates and currencies revenues, and Banking reporting investment up 34% from the prior year period. Net income was up 2% (y/y) to $3.5B.
Citigroup: Reported Sales versus Analyst Forecast. Source: CNN Business
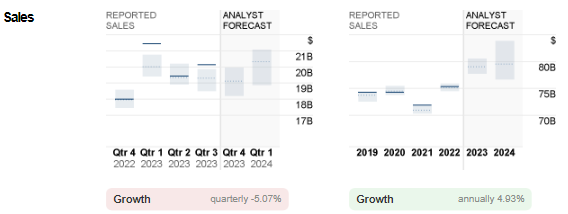
Expected sales revenue for the final quarter of 2023 stood at $19.1B, slightly down nearly -5% from the previous quarter, but up over 6% from the same period last year. Total sales revenue for FY 2023 shall hit $79.1B, if the reported figure aligns with forecasts. According to the management’s guidance, the figure is expected to be between $78B and $79B.
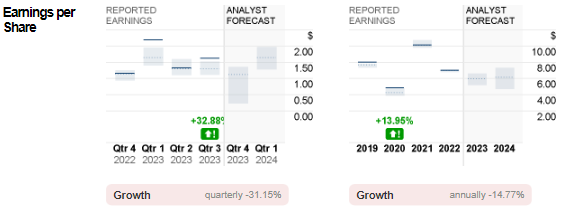
EPS for Q4 2023 is estimated to be down from $1.63 to $1.12. In the same quarter last year, the bank’s EPS was recorded at $1.16.
Technical Analysis:
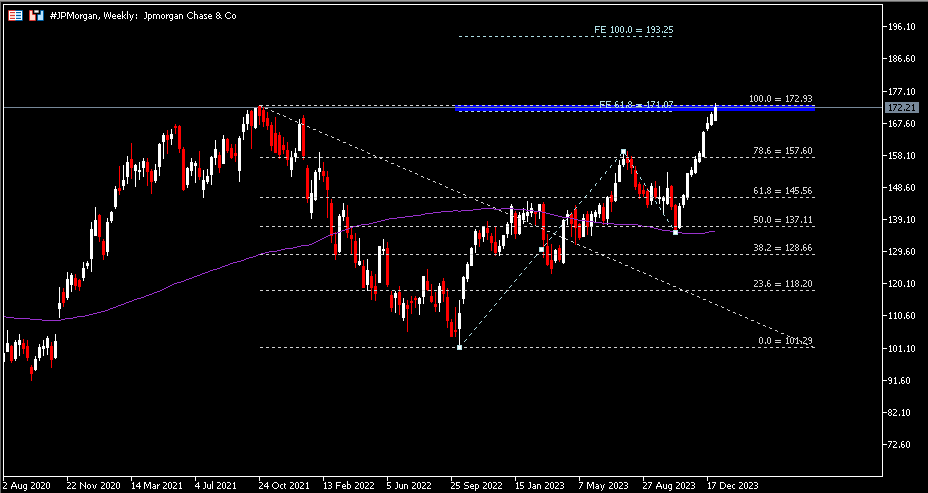
The #JPMorgan share price had a strong bullish streak for ten consecutive weeks. The asset refreshed its ATH last seen in October 2021 ($172.93), at $173.37, before closing the week at $172.21. The area between $171 and $173 remains the nearest resistance zone, followed by $193 and $209 as projected by Fibonacci Expansion. On the other hand, $159.36 (July 2023’s high) and $157.60 (FR 78.6%, expanded from the previous ATH to lows in Oct 2022) serve as the nearest support. Breaking below this level may indicate price correction to extend towards the next support at $145.60 (FR 61.8%) and $137 (FR 50.0%).
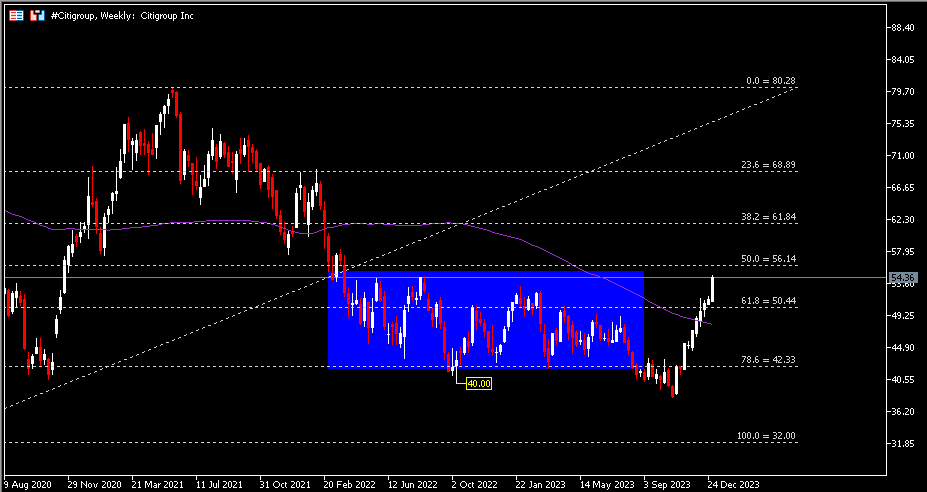
The #Citigroup share price saw a vigorous rebound in the last two months of 2023, leaving the year low at $38.16. Stepping into 2024, the asset continued to surge higher, last closing at $54.36. The FR 50.0%, or $56 serves as the nearest resistance, and also an essential indicator for a correction in trend direction. R2 and R3 each stood at $61.85 (FR 38.2%) and $68.90 (FR 23.6%). On the contrary, $50.45 (FR 61.8%) will be the nearest support, followed by the 100-week SMA and $42.30 (FR 78.6%).
Click here to access our Economic Calendar
Larince Zhang
Market Analyst
Disclaimer: This material is provided as a general marketing communication for information purposes only and does not constitute an independent investment research. Nothing in this communication contains, or should be considered as containing, an investment advice or an investment recommendation or a solicitation for the purpose of buying or selling of any financial instrument. All information provided is gathered from reputable sources and any information containing an indication of past performance is not a guarantee or reliable indicator of future performance. Users acknowledge that any investment in Leveraged Products is characterized by a certain degree of uncertainty and that any investment of this nature involves a high level of risk for which the users are solely responsible and liable. We assume no liability for any loss arising from any investment made based on the information provided in this communication. This communication must not be reproduced or further distributed without our prior written permission.


