Microsoft Corp., an American multinational technology conglomerate which actively engages in the development and support of software, services, devices and solutions, shall report its financial results for FY24 Q2 on 30th January (Tuesday), after market close.
Interestingly, Microsoft is currently ranked the most valuable company, at $2.96T. It has beaten Apple, Inc for the first time since 2021, driven by its lead in generative AI (through its investment in ChatGPT-maker OpenAI) as well as the dampening outlook over sales demand of Apple Inc .
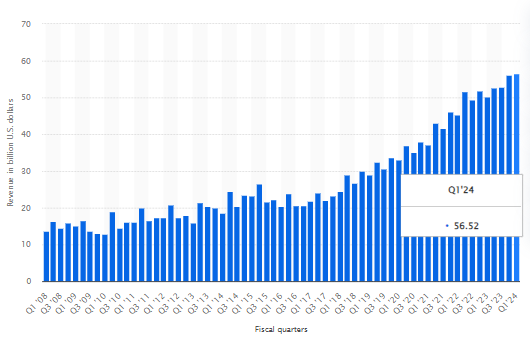
Microsoft’s Revenue (in billion USD). Source: Statista
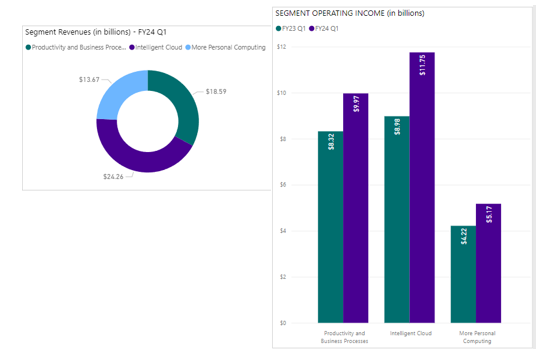
Microsoft derives its revenues from three main segments. The first segment is Productivity and Business Processes, which includes products and services such as Office Commercial, Office Consumer, LinkedIn and Dynamic Business Solutions. The second segment is Intelligent Cloud, including various Server Products and Cloud Services, as well as Enterprise Services. The third segment is More Personal Computing, involving Windows, Devices, Gaming, Search and News Advertising.
In general, Microsoft’s revenue hit a record at $56.53B, up 0.61% from the previous quarter, and up 12.8% from the same period last year. The company sales revenue has almost tripled within the last twelve years. Based on these past data, the largest increase in quarterly revenue was more than $6B, which was seen between Q1 and Q2 2010.
Segment Revenues and Operating Income (in billions). Source: Microsoft
In the previous quarter, the Intelligent Cloud segment continued to be contributing the most to the company’s revenue, at $24.26B (+19.3% y/y). Productivity and Business Processes and More Personal Computing drove $18.59B (+12.9% y/y) and $13.67B (+2.6% y/y) in sales, respectively.
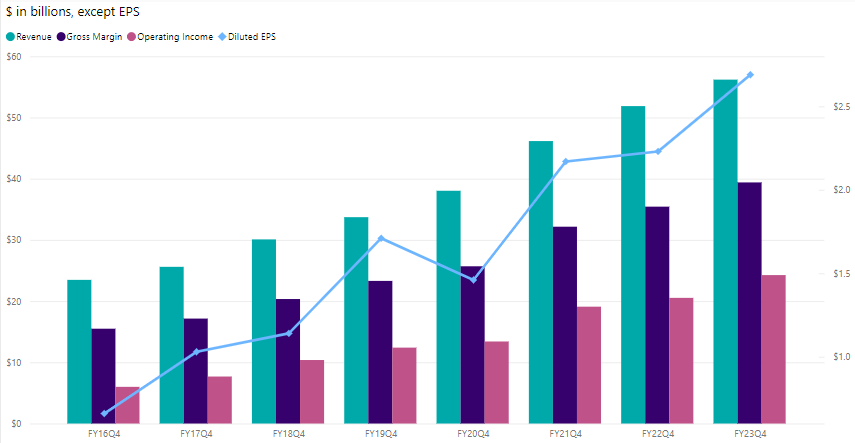
Trended Historical Financial. Source: Microsoft
Operating income of Intelligent Cloud was up +31% (y/y) to $11.75B, while Productivity and Business Processes was up nearly +20% (y/y) to $9.97B. More Personal Computing edged up over +22% (y/y) to $5.17B. Net income was $22.3B, up +27% from the same period last year. Similar with operating income, the gross margin of Microsoft has been improving steadily. In the previous quarter, it was $39.4B, up over 16% from the same period last year.
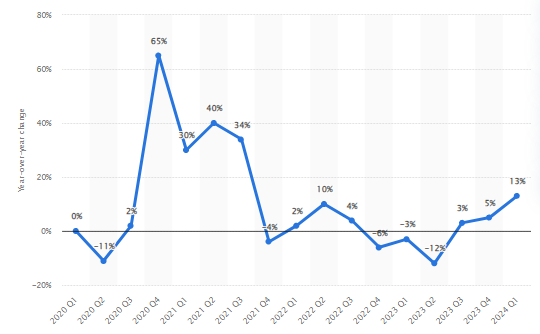
Xbox Content and Services Revenues (YoY). Source: Statista
An acquisition of Activision Blizzard could be a massive game changer for the company, which is claimed to be “a boom for the Xbox Game Pass subscription service”. Some analysts even project a possibility for Microsoft to move ahead of its major rival, Sony PlayStation in terms of game revenue for the first time ever in the very near future (whilst Tencent still leading the competition).
 Microsoft: Reported Sales and EPS versus Analyst Forecast. Source: CNN Business
Consensus estimates for Microsoft’s sales revenue in the coming announcement stood at $58.8B, up over 4% from previous quarter’s $56.2B, and up over 11% from the same period last year. EPS is expected to hit $2.69, down 30 cents from the previous quarter. It was $2.32 in Q1 2023.
Technical Analysis:
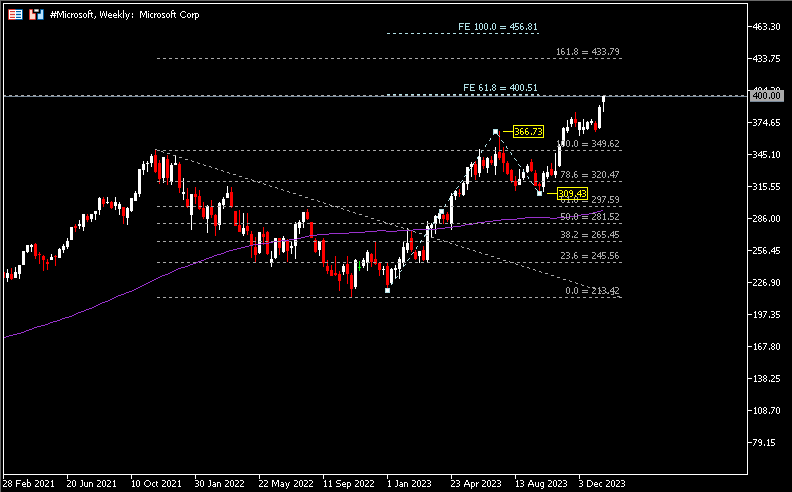
#Microsoft, Weekly: Despite the robust economic data and Fed speak which recently pushed out expectations for the Fed’s first rate cut coming in March, enthusiasm over generative AI technology continued to drive the large technology players. The Microsoft share price closed the third week of 2024 higher, leaving its ATH at $398.56. The nearest resistance is seen at $400.50, a level projected from Fibonacci Expansion, followed by FR 161.8%, at $435. On the other hand, a technical correction should lead the price to retrace back to test the high seen in July 2023, at $366.73, and then $350.
Click here to access our Economic Calendar
Larince Zhang
Market Analyst
Disclaimer: This material is provided as a general marketing communication for information purposes only and does not constitute an independent investment research. Nothing in this communication contains, or should be considered as containing, an investment advice or an investment recommendation or a solicitation for the purpose of buying or selling of any financial instrument. All information provided is gathered from reputable sources and any information containing an indication of past performance is not a guarantee or reliable indicator of future performance. Users acknowledge that any investment in Leveraged Products is characterized by a certain degree of uncertainty and that any investment of this nature involves a high level of risk for which the users are solely responsible and liable. We assume no liability for any loss arising from any investment made based on the information provided in this communication. This communication must not be reproduced or further distributed without our prior written permission.


