USDCAD
The decidedly data dependent Bank of Canada has maintained that the current sluggish growth performance is a detour from the expansionary path that prevailed before a plunge in oil prices severely restrained Q4 GDP. Several important reports are due ahead of the April 24 policy announcement, with the releases having scope to influence expectations for a more dovish tone or even a rate cut further out on the horizon.
As we saw earlier today, Canada’s CPI and trade reports supported a steady BoC policy next week, with no shift anticipated in the cautiously optimistic outlook for growth. CPI jumped to a 1.9% y/y pace in March from 1.5% in February, as expected amid a run-up in gasoline prices. The surprise of the report was that core CPI measures mostly accelerated.
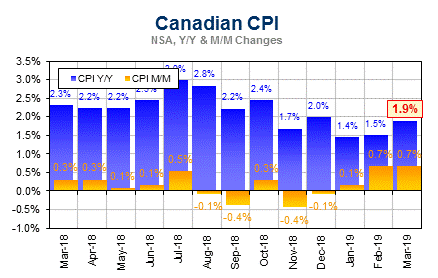
Meanwhile, the trade deficit narrowed by a bit more than expected to -C$2.9 bln in February from -C$3.1 bln in January, but exports fell 1.3% m/m while imports contracted 1.6% to leave a mixed takeaway on trade.
The pick-up in the annual growth rates of two of three core CPI measures to back or above 2.0% is the most significant development in terms of the BoC policy outlook, as it supports the BoC’s view that the slowing in the economy over Q4/Q1 is temporary, with underlying inflation seen returning to the 2% area from below as the delayed expansion resumes later this year.
More data is needed of course, but the March CPI report has eliminated the already very thin chance for a rate cut later this year, as it was close to expectations, and hence consistent with the Bank’s view that the economy will continue to recover from the oil price shock through the first half.
Resilience outside of the oil-producing regions does track the expectations that rates will eventually need to move higher again, likely in late 2020.
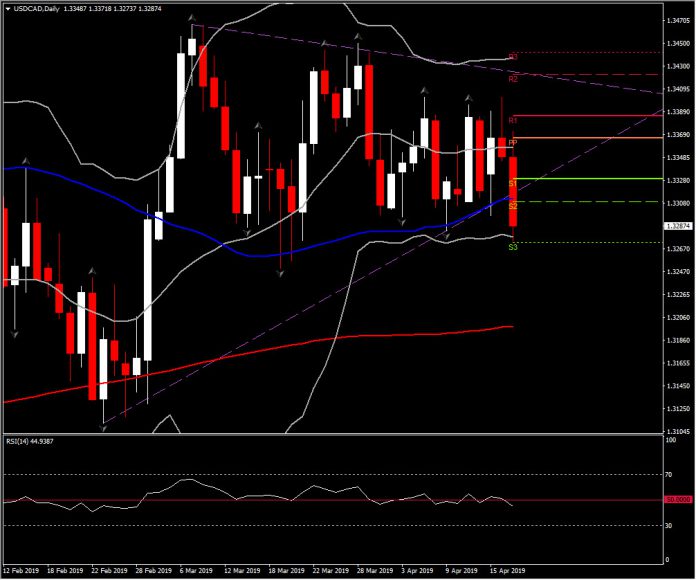
In the currency market meanwhile, USDCAD fell following the warmer Canada CPI outcome and the narrowed trade deficit. The pairing fell from 1.3330 to under 1.3270, printing a 1-month low in the process. Next risk event for the CAD comes at 12:30 GMT with the weekly EIA oil inventory report on tap.
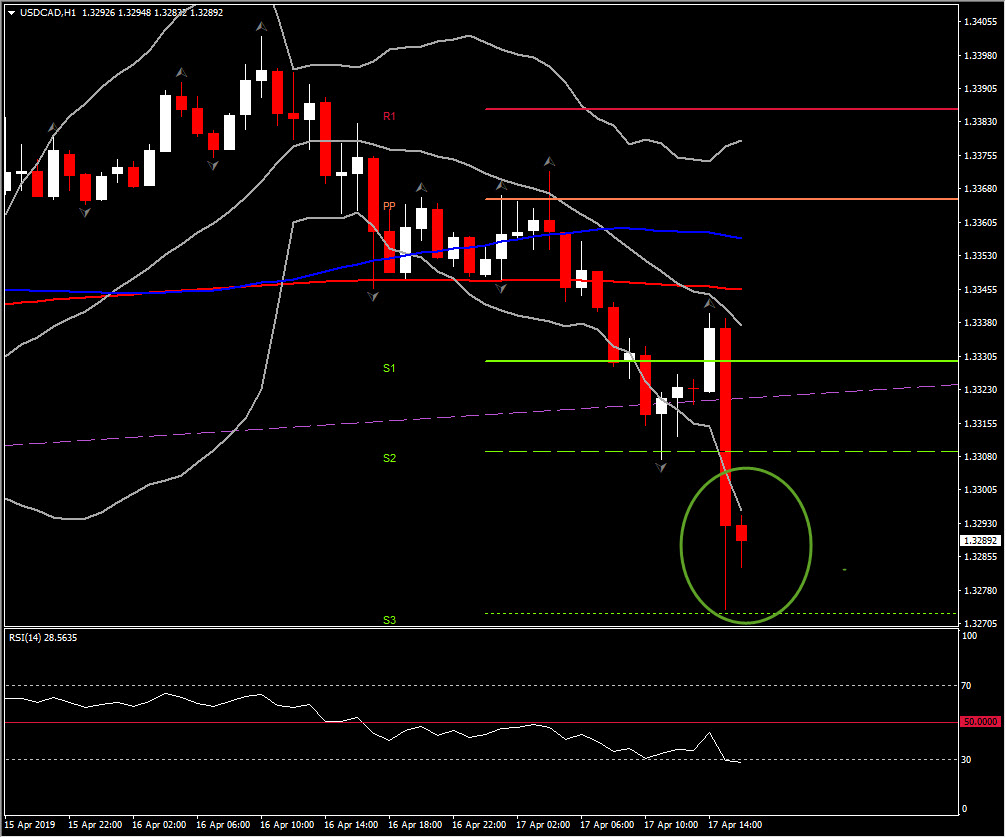
However till then, the hourly chart looks extremely oversold, since the price moves outside the lower Bollinger Bands, below all 3 MAs with RSI at 30 and Stochastic looking to the downside again. The sharp move outside of BB could be followed by a correction to the upside within the day.
Next Support levels are set at: 1.3270 and 1.3250.
Next Resistance levels are set at:1.3310 and 1.3330.
Click here to access the Economic Calendar
Andria Pichidi
Market Analyst
Disclaimer: This material is provided as a general marketing communication for information purposes only and does not constitute an independent investment research. Nothing in this communication contains, or should be considered as containing, an investment advice or an investment recommendation or a solicitation for the purpose of buying or selling of any financial instrument. All information provided is gathered from reputable sources and any information containing an indication of past performance is not a guarantee or reliable indicator of future performance. Users acknowledge that any investment in FX and CFDs products is characterized by a certain degree of uncertainty and that any investment of this nature involves a high level of risk for which the users are solely responsible and liable. We assume no liability for any loss arising from any investment made based on the information provided in this communication. This communication must not be reproduced or further distributed without our prior written permission.


