


For the fifth consecutive day, gold prices increased to reach $2,025, recouping all losses from the previous week’s CPI data. The pace of gold’s recovery shows that investors are willing to cover losses, indicating continued buying.
The release of the minutes of the January Federal Open Market Committee (FOMC) meeting showed that most participants noted the risks of acting too quickly to ease policy and emphasized the importance of carefully assessing incoming data in judging whether inflation is moving down sustainably to a rate lower than 2%. The Fed is currently projected to keep interest rates unchanged in March and May however there is a 55% chance the central bank will cut borrowing costs by 25 basis points in June. The recent rise in gold is likely due to the increased likelihood, that the Fed will start cutting rates in June.
Safe-haven demand also lifted gold amid rising geopolitical tensions in the Middle East. Houthi militants in Yemen said earlier this week that they targeted two US ships with missiles in the Gulf of Aden, in the latest attack to disrupt shipping routes in the region.
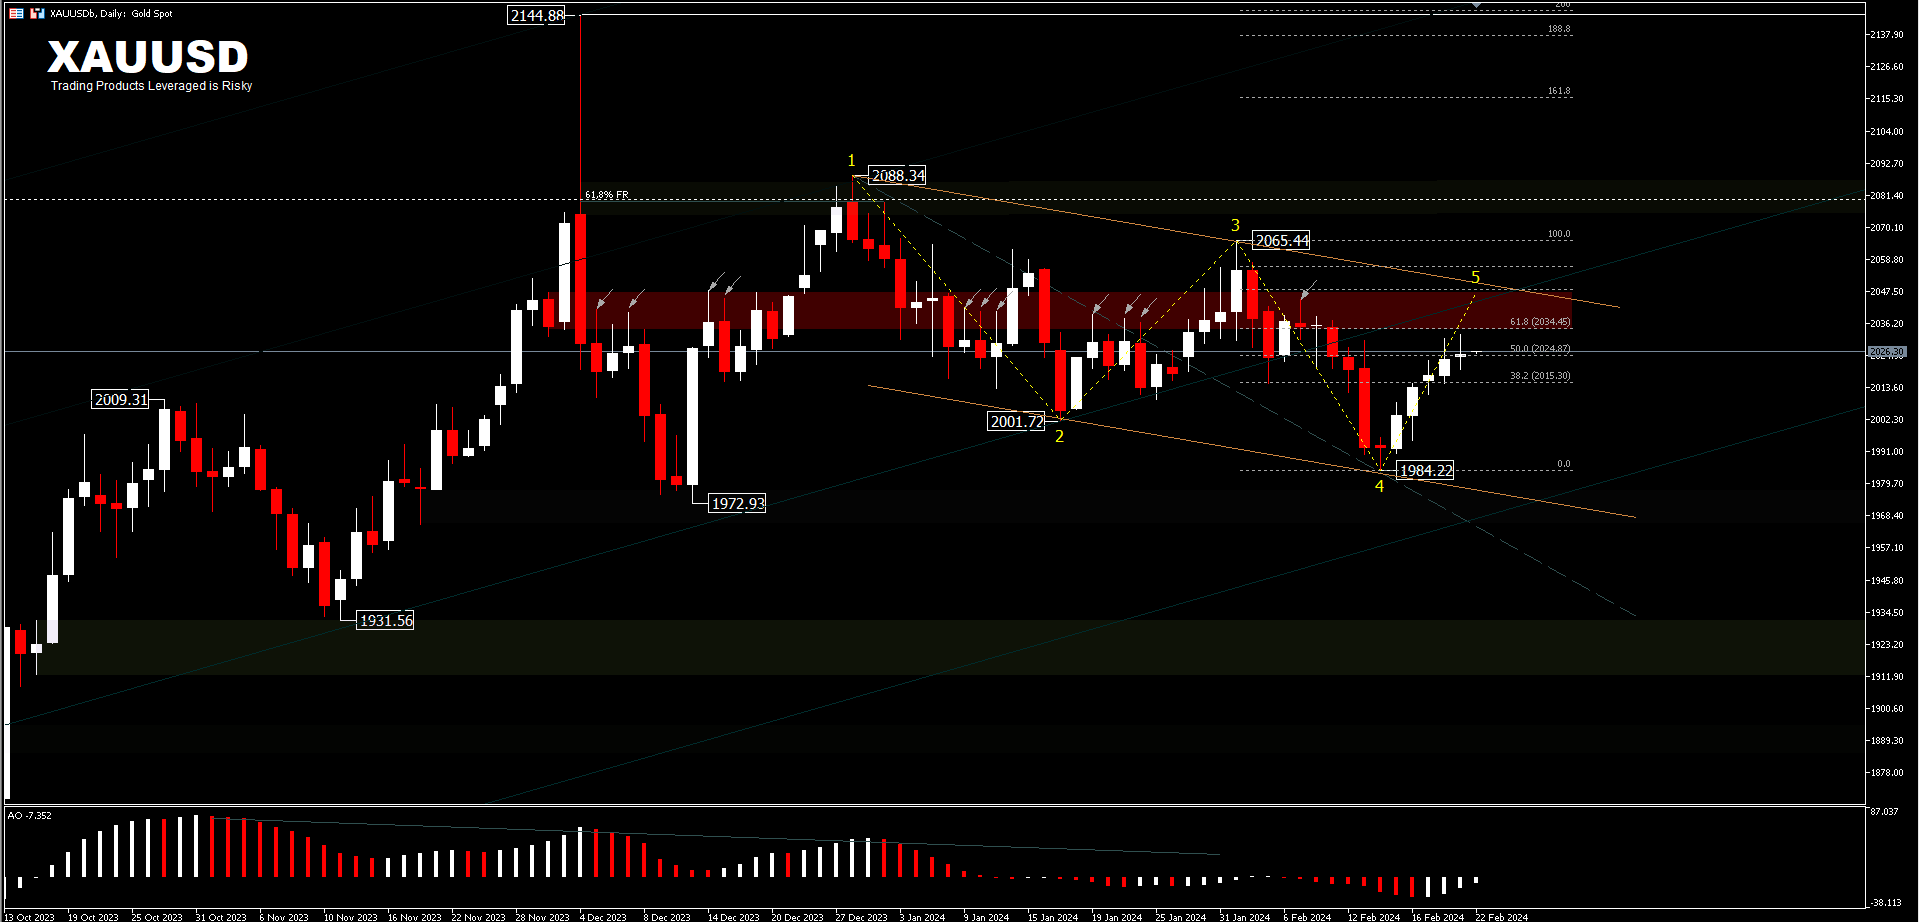
XAUUSD, D1
When viewed from the beginning of 2024, gold prices have followed market expectations of a downward trend. Despite being under significant selling pressure due to higher-than-expected January US inflation last week. An upside to $2,030-US$2,040 looks quite constrained, as a major intermediate level considering this area as a bounce zone that presented many shaded daily candles in the past.
And before that, the two-week high near $2,035 (61.8%FR level) also seems important. Buying above that level would be an important signal to test the upper limit of the bearish range, indicating that the recent adjustment has reached its peak. More important, however, is gold’s price performance near $2,050, where a continuation of the move higher would reverse the downtrend of late January. Consolidation at this level will confirm the end of the corrective downtrend and open up opportunities for a move to the upside.
For now, the price area of 2035 to 2040, could be a calculated barrier to bring some declines, if it proves that this price level acts as a strong resistance zone and remains intact.
Click here to access our Economic Calendar
Ady Phangestu
Market Analyst – HF Educational Office – Indonesia
Disclaimer: This material is provided as a general marketing communication for information purposes only and does not constitute an independent investment research. Nothing in this communication contains, or should be considered as containing, an investment advice or an investment recommendation or a solicitation for the purpose of buying or selling of any financial instrument. All information provided is gathered from reputable sources and any information containing an indication of past performance is not a guarantee or reliable indicator of future performance. Users acknowledge that any investment in Leveraged Products is characterized by a certain degree of uncertainty and that any investment of this nature involves a high level of risk for which the users are solely responsible and liable. We assume no liability for any loss arising from any investment made based on the information provided in this communication. This communication must not be reproduced or further distributed without our prior written permission.


