


America’s bank conglomerates – JPMorgan and Citigroup – shall deliver their Q1 2024 earnings result this Friday (12h April) before market open.
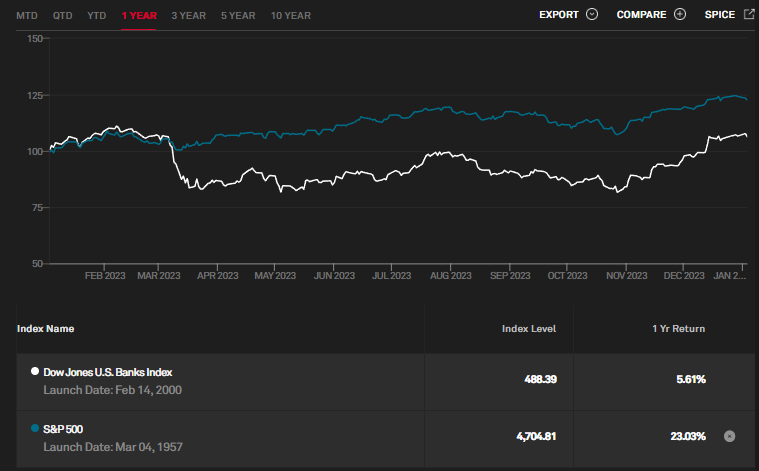
S&P500 & Dow Jones U.S. Banks Index Performance. Source: SPGlobal
Dow Jones US Banks Index has performed better than S&P500 in the near term, with quarter-to-date (QTD) and month-to-date (MTD) up 12.86% and 7.98% respectively, versus 10.16% and 3.10% for S&P500. According to BofA analysts, “the Fed’s dot plot for 2024 and the repeated reference of ‘fairly soon’ when discussing the timing of QT taper were both positive for bank stocks”; “increased confidence for easing monetary policy could cause markets to dial-back the probability of tail risk events, while increasing the odds for a 1995 ‘soft landing scenario’ for bank stocks.”
JPMorgan
JPMorgan is the world’s largest bank by market capitalization (nearly $577B). It offers a range of financial and investment banking services and products in all capital markets, including advising on corporate strategy and structure, capital raising in equity and debt markets, risk management, market making in cash securities and derivative instruments, brokerage and research.
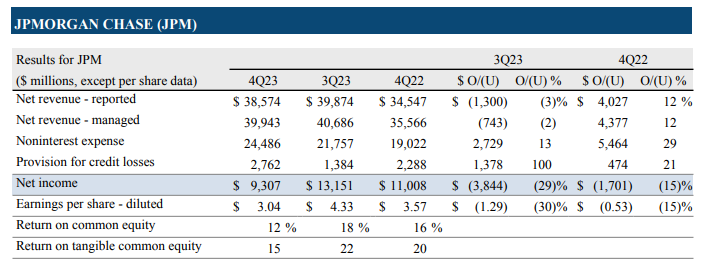
JPMorgan: Financial Measures. Source: Earnings Press Release
In Q4 2023, JPMorgan delivered $38.6B in net revenue, down -3% from the previous quarter, but up 12% from the prior year period. Excluding First Republic, net income was $9.3B, down -15% (y/y) (or -21% (y/y) excluding First Republic), predominantly driven by the FDIC special assessment, which shaved 74 cents per share from the bank’s profit.
By business segment, Consumer & Community Banking contributed the most to the banks’ revenue ($18.1B, with continuous improvement in Banking and Wealth Management, Home Lending, Card Services and Auto, slightly offset by increase in non interest expense and provision for credit losses), followed by Corporate & Investment Bank ($11.0B, with banking and markets & securities services up 6% and 2% respectively, from the same period last year), Asset & Wealth Management ($5.1B, up 11% (y/y)) following higher management fees on strong net inflows and higher average market levels, slightly offset by lower net interest income), Commercial Bank ($4.0B, driven by higher net interest income, payments revenue and investment banking revenue, partially offset by lower deposit balances), and finally Corporate ($1.8B).
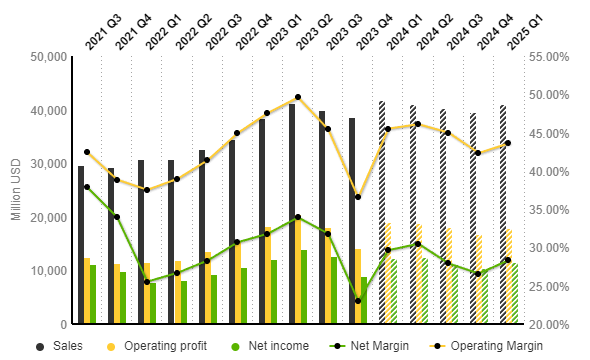
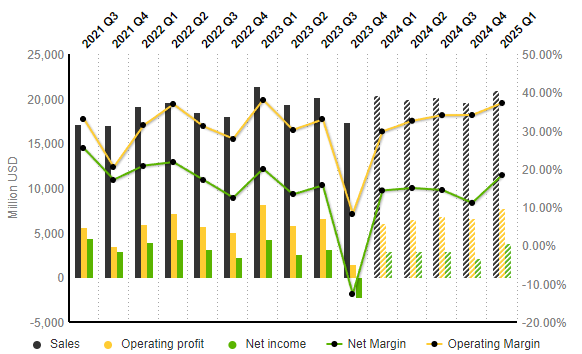
JPMorgan: Income Statement Evolution (Quarterly Data). Source: Market Screener
According to projections by S&P Global Market Intelligence, sales revenue for the coming quarter is expected to reach $41.8B, up 8.3% from the previous quarter, and up 9.1% from the same period last year. Net income is projected to hit $19B, up 34.8% (q/q) and 4.4% (y/y) respectively. In addition, net margin is projected to have improved significantly towards 29.64% compared to the previous quarter (22.99%), but slightly lower than Q1 2023 (31.79%).
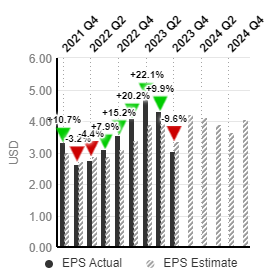
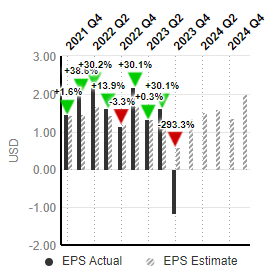
JPMorgan EPS. Source: Market Screener
EPS, on the other hand, is expected to hit $4.22, higher than the previous quarter by nearly 39%. The EPS was $3.10 in Q1 2023.
Citigroup
Citigroup, formed by the merger of banking giant Citicorp and financial conglomerate Travelers Group in 1998, has a market capitalization over $121B. It operates through Global Consumer Banking (traditional banking services for retail customers), Institutional Clients Group (fixed income and equity research, sales and trading, foreign exchange, prime brokerage, derivative services, investment banking and advisory services, private banking, trade finance and securities services), and Corporate and Other (including un-allocated costs of global staff functions, other corporate expenses, un-allocated global operations and technology expenses).
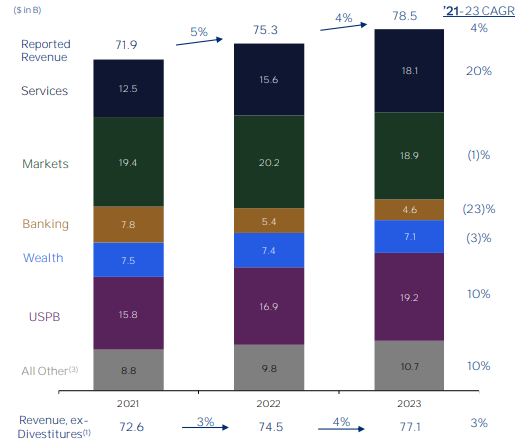
Citigroup: Full Year Revenue Trend. Source: Earnings Presentation
In Q4 2023, Citigroup reported $17.4B in revenue, down -13% (q/q) and -3% (y/y) respectively. The less satisfying result was mainly driven by lower volatility in Markets, slow recovery in both IB and Wealth as well as Argentina’s devaluation impact, partially offset by continued momentum in Services and Cards. Net income resulted in a loss of -$1.8B, following higher expenses and cost of credit, which more than offset the lower revenues.
Nevertheless, the bank managed to achieve 4% (y/y) gains in revenues throughout FY 2023, at $78.5B. By business segment, Services and US Personal Banking were up 16% (y/y) and 14% (y/y), respectively; On the other hand, Banking reported the most losses (-15% (y/y)), followed by Markets (-6% (y/y)) and Wealth (-5% (y/y)). Net income of Citigroup for FY2023 stood at $9.2B, lower than FY2022 by -38%.
Citigroup: Income Statement Evolution (Quarterly Data). Source: Market Screener
Similar to JPMorgan, projections for Citigroup financial performance seem brighter than the previous quarter. Sales revenue is expected to reach $20.4B, up 17.2% from the previous quarter, but down -4.7% from the same period last year. Net income is expected to turn from losses in the previous quarter, -$2.2B, to $2.9B. This would in turn cause the net margin to increase sharply from -12.72% to 14.36%, but still below Q1 2023 at 20.03%.
Citigroup EPS. Source: Market Screener
EPS is estimated to hit $1.37, was -$1.16 in the previous quarter and $2.19 in Q1 2023.
Technical Analysis:
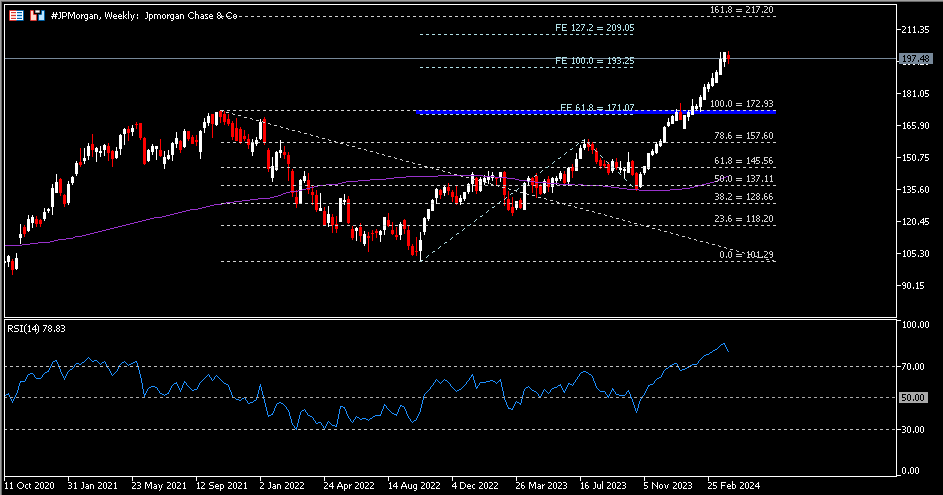
#JPMorgan share price has closed bullish for 5 consecutive months. The asset last closed bearish at $197.48, below resistance $209 (FE 127.2%). RSI indicator hovered at overbought zone, which may explain a decreasing bullish momentum in the meantime. $193.25 (FE 100.0%) would serve as the nearest support, followed by $171 – $173 area. The overall trend remains upward unless the asset retraces more than 50% of the trend in which it has been gaining support since end of October last year.
Similarly, #Citigroup share price has been riding on a strong bullish trend since gaining support in October last year. It last closed bearish, retesting previous high $61.80 (FR 38.2% extending from the lows in March 2020 to highs in May 2021). RSI indicator also seen hovering at overbought zone. Therefore, a close below $61.80 may indicate short-term technical correction, towards the next support at $56 (FR 50.0%) and $50.45 (FR 61.8%). Otherwise, a break above the said resistance may suggest bullish continuation, with focus on the next resistance at $68.90 (FR 23.6%).
Click here to access our Economic Calendar
Larince Zhang
Market Analyst
Disclaimer: This material is provided as a general marketing communication for information purposes only and does not constitute an independent investment research. Nothing in this communication contains, or should be considered as containing, an investment advice or an investment recommendation or a solicitation for the purpose of buying or selling of any financial instrument. All information provided is gathered from reputable sources and any information containing an indication of past performance is not a guarantee or reliable indicator of future performance. Users acknowledge that any investment in Leveraged Products is characterized by a certain degree of uncertainty and that any investment of this nature involves a high level of risk for which the users are solely responsible and liable. We assume no liability for any loss arising from any investment made based on the information provided in this communication. This communication must not be reproduced or further distributed without our prior written permission.


