Crude oil continues to trend downward as geopolitical tensions in the Middle East ease. This removes concerns about world supply, although demand appears to be declining. The trading price of crude oil has fallen more than 9% from its previous high. Although there may be some speculative buying.
Oil prices on Monday rose more than 1% to $78.55 per barrel, supported by slight signs of improving demand in China and concerns over potential supply disruptions in Canada. Chinese data showed consumer prices increased for the third consecutive month in April, indicating an increase in domestic demand. Investors are also monitoring potential oil supply disruptions due to wildfires in Western Canada, which could impact the country’s daily oil sands production capacity of 3.3 million barrels.
In addition, expectations that OPEC+ will extend supply cuts into the second half of the year have also supported oil prices. Iraq, the second-largest OPEC producer, has committed to the production cuts agreed by the producer group. Meanwhile, traders are keeping a close eye on Middle East developments.
Meanwhile, API and EIA inventory data may provide clues to crude oil prices this week, as high stocks may indicate further declines. In addition, market sentiment towards US inflation reports may impact crude oil prices. Unexpectedly weak US Producer Price Index (PPI) and Consumer Price Index (CPI) statistics could increase speculation of Fed policy easing, which could weaken the US dollar and increase the value of riskier assets such as crude oil. On the other hand, strong inflation statistics could kill expectations of a Federal Reserve rate cut in June or July, which might cause the US dollar to appreciate more against crude oil.
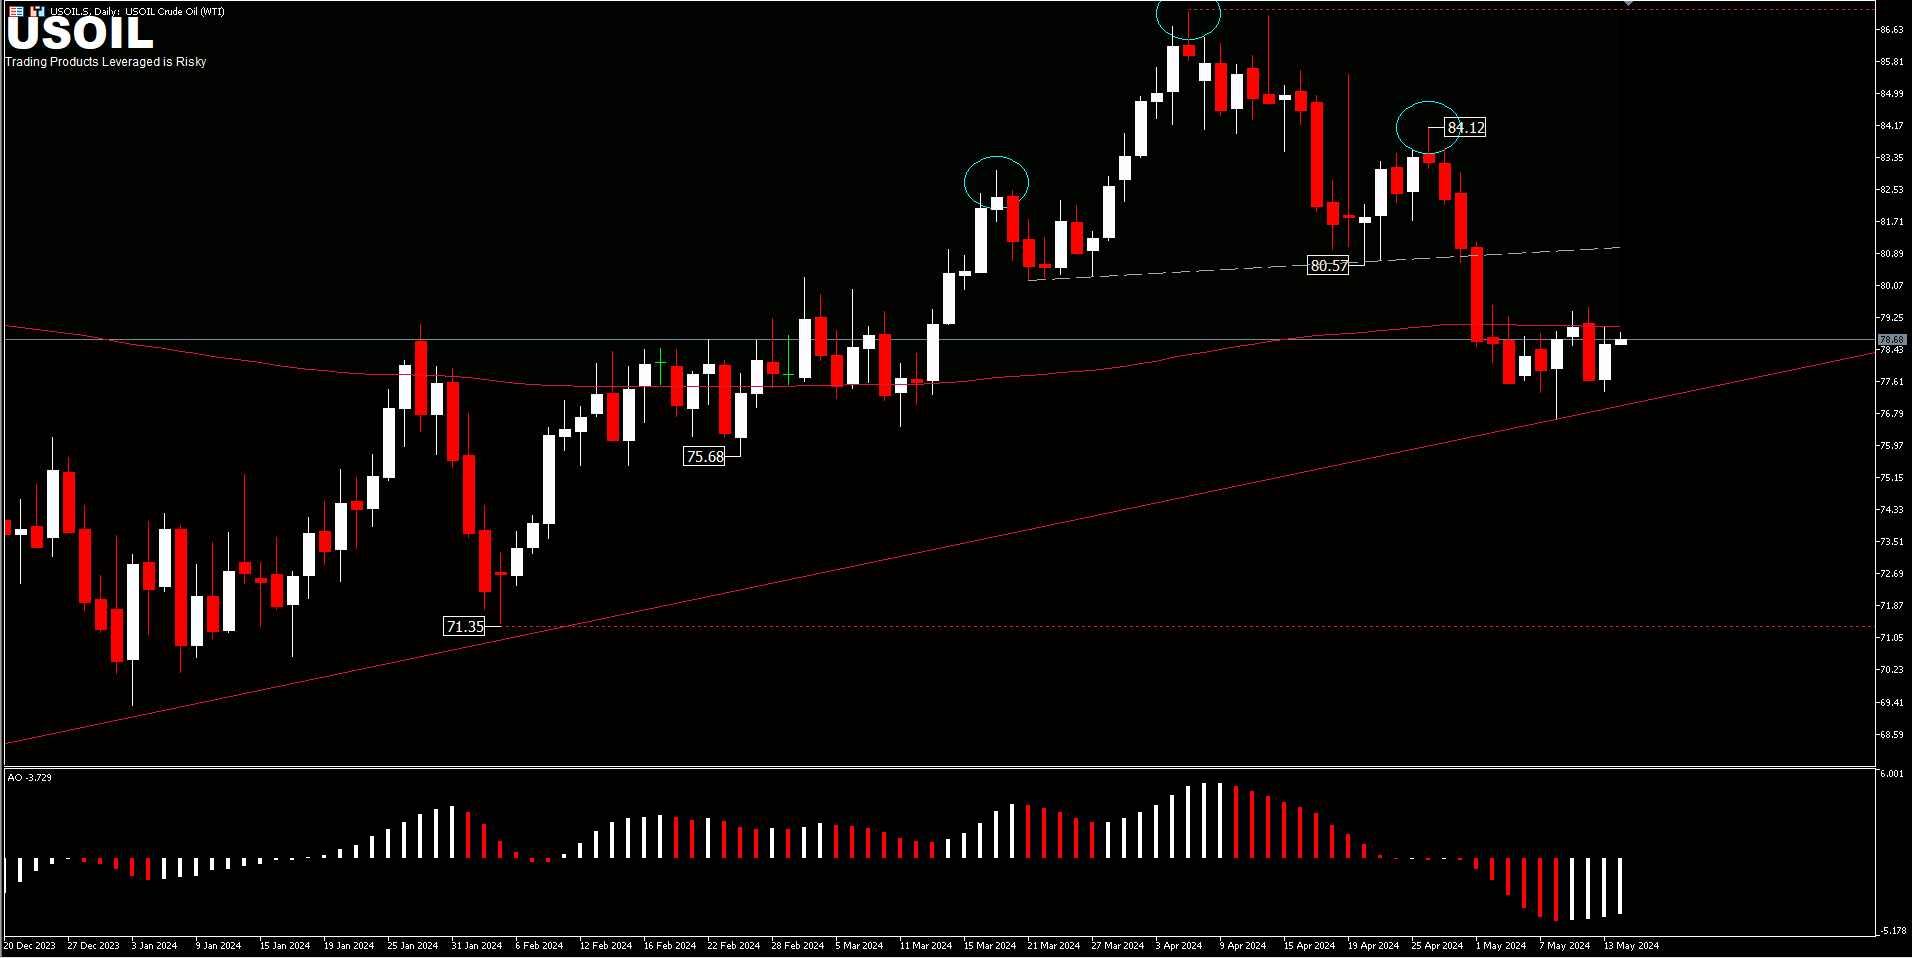
USOIL, DAILY
USOIL, DAILY
From USOIL’s technical perspective, the downside breakout at the $80.57 support has confirmed the “head and shoulder” pattern on the daily chart. The major obstacle is now seen at the bullish trendline. A move below this trendline could test another support zone at $76.45 or $75.68 in the short term. While a move to the upside, could test the $80.57 neckline support and bring consolidation first. For now, the price is seen consolidating below the 200 EMA and Trendline.
Market Analyst – HF Educational Office – Indonesia
Disclaimer: This material is provided as a general marketing communication for information purposes only and does not constitute an independent investment research. Nothing in this communication contains, or should be considered as containing, an investment advice or an investment recommendation or a solicitation for the purpose of buying or selling of any financial instrument. All information provided is gathered from reputable sources and any information containing an indication of past performance is not a guarantee or reliable indicator of future performance. Users acknowledge that any investment in Leveraged Products is characterized by a certain degree of uncertainty and that any investment of this nature involves a high level of risk for which the users are solely responsible and liable. We assume no liability for any loss arising from any investment made based on the information provided in this communication. This communication must not be reproduced or further distributed without our prior written permission.