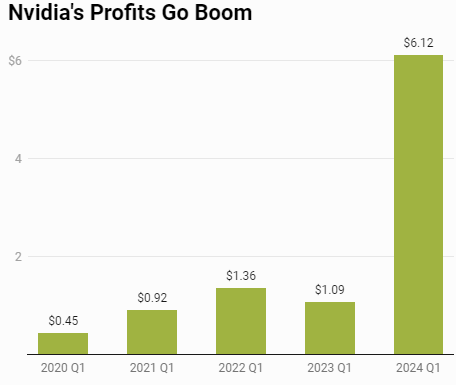
Nvidia share price unlocked the $1000 milestone as the chip designer and AI behemoth reported revenues and profits skyrocketed by 262% (y/y) and 628% (y/y) respectively to $26B and $14.9B – this marked the company’s most profitable and highest sales quarter ever/. Non-GAAP earnings per diluted share (EPS) has up massively by 461% from a year ago.

As expected, the company’s AI-intensive data center division serves as the major catalyst for Nvidia’s financial growth. The segment reported $22.6B in revenue, up 427% from the same period last year. As compared to the $1.1B brought in by the segment in 2020, the figure today has been increased by a whopping 20 times!
“AI will bring significant productivity gains to nearly every industry and help companies be more cost- and energy-efficient, while expanding revenue opportunities” – Jensen Huang, Nvidia’s CEO.
Also, Nvidia announced a 10-for-1 forward stock split of Nvidia’s issued common stock. Each record holder of common stock as of market close on 6th June 2024, shall receive nine additional shares of common stock, to be distributed after market close on 7th June 2024. Trading is expected to commence on a split-adjusted basis at market open on 10th June 2024.
In fact, Nvidia has undergone a total of 6 stock splits since launching its IPO in 1999, most recently about three years ago for a 4-for-1 split. Theoretically, a stock split which resulted in lowered per-share value (without a change in the stock’s valuation) shall attract more individual investors, keeping the retail attraction flows. According to BofA Global Research, companies that announced stock splits have seen their shares rise an average of 25.4% over the next 12 months, versus an 11.9% rise for the S&P 500.
Technical Analysis:
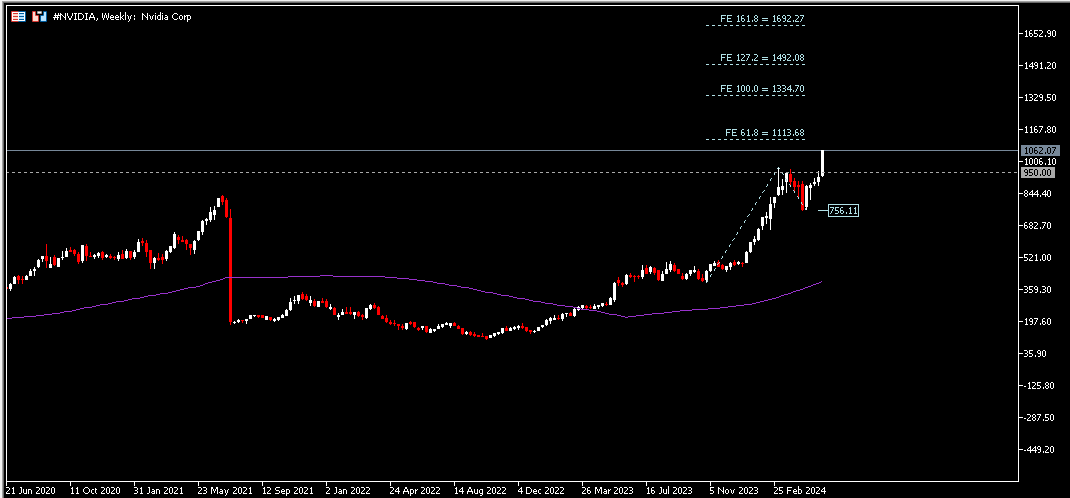
#Nvidia, Weekly: Nvidia share price extended gains and formed a new ATH at $1062.68, following the company’s upbeat earnings result and its announcement to split stock. Overall trend remains bullish. According to FE projection, nearest resistance is seen at $1114, followed by $1335. On the other hand, previous ATH $973.68 and $950 serve as the nearest support zone.
Click here to access our Economic Calendar
Larince Zhang
Market Analyst
Disclaimer: This material is provided as a general marketing communication for information purposes only and does not constitute an independent investment research. Nothing in this communication contains, or should be considered as containing, an investment advice or an investment recommendation or a solicitation for the purpose of buying or selling of any financial instrument. All information provided is gathered from reputable sources and any information containing an indication of past performance is not a guarantee or reliable indicator of future performance. Users acknowledge that any investment in Leveraged Products is characterized by a certain degree of uncertainty and that any investment of this nature involves a high level of risk for which the users are solely responsible and liable. We assume no liability for any loss arising from any investment made based on the information provided in this communication. This communication must not be reproduced or further distributed without our prior written permission.


