


- Is the Dow Jones undervalued? From the 10th -14th of June the NASDAQ rose 3.77%, and the SNP500 by 1.70%, while the Dow Jones fell for 4 consecutive days.
- According to the Chicago exchange, there is a 62% chance of a rate cut in September due to lower inflation. Prior to last week’s inflation rate announcement, the possibility of a rate cut was only 35%.
- European indices trade higher as they attempt a quick correction after their worst week in 2024.
- The US Dollar Index maintains its value despite lower inflation and a higher possibility of a rate cut.
USA30 – Is the Dow Undervalued?
The Dow Jones is the only index which has not witnessed a strong rise in value. For example, last week the NASDAQ rose 3.77% and the SNP500 by 1.70%. The reason for this is due to the index’s lack of exposure to the technology sector and growth stocks. The Dow Jones is exposed largely to defensive stocks and high dividend yielding stocks. Of the top 10 most influential stocks for the Dow Jones, 5 rose in value while 5 declined. Hence, the lack of growth.
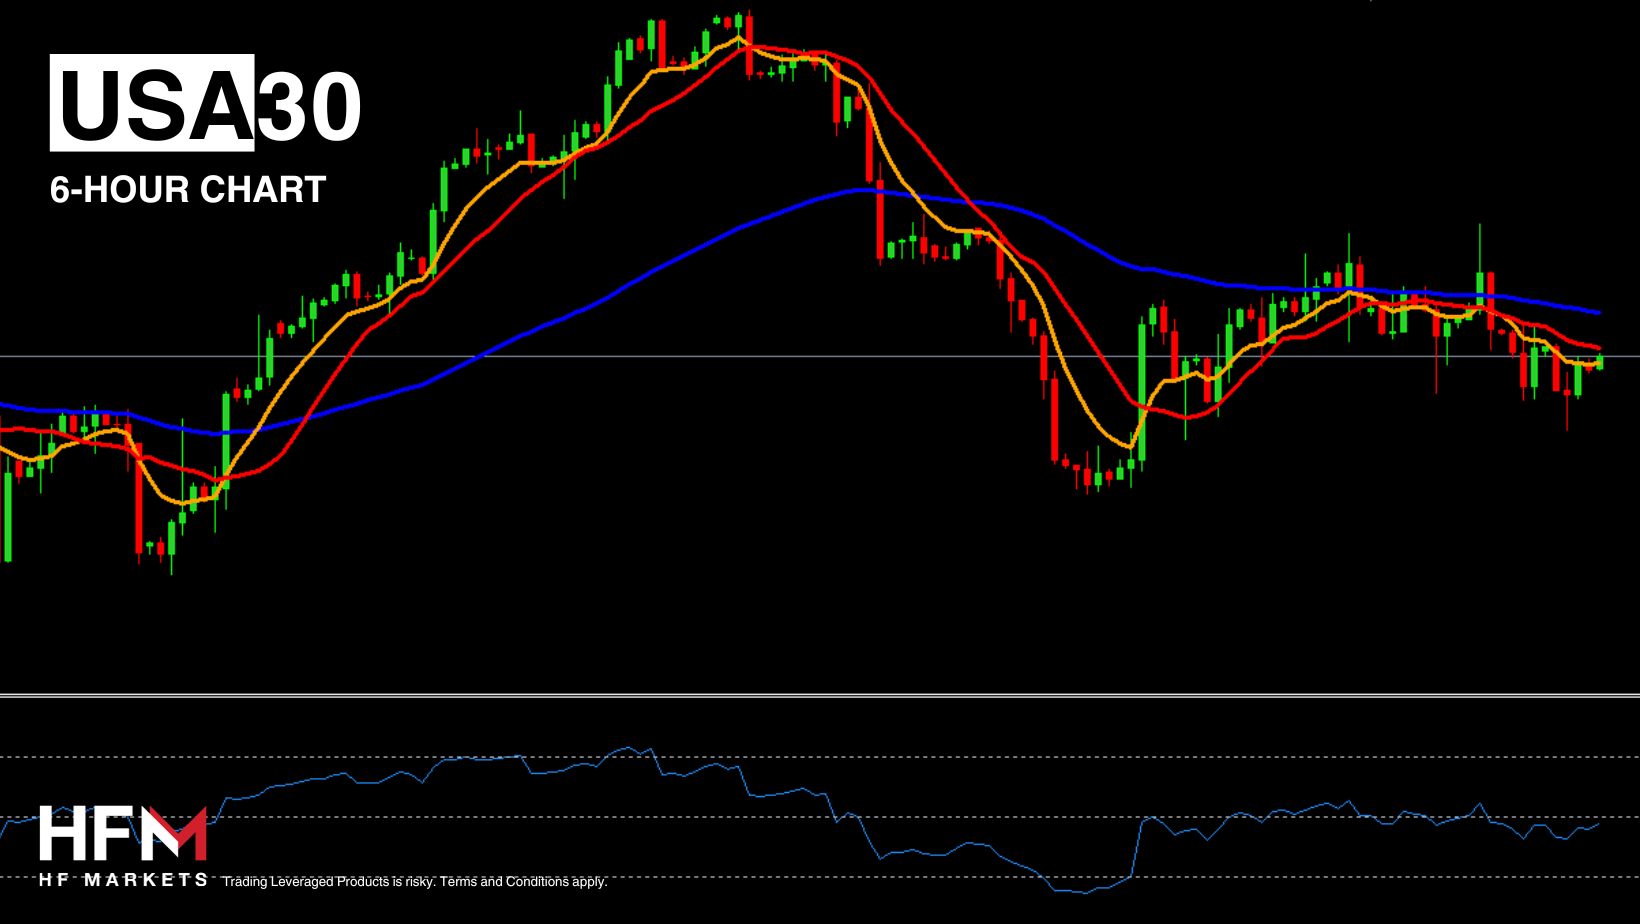
Nonetheless, investors are also contemplating whether the index is undervalued. The economic data from last week is ideal for monetary policy as it points towards lower inflation and weaker employment. The US inflation rate fell to 3.3%, core inflation to 3.4% and producer inflation to 2.24%. The inflation reading was ideal for all stocks and supports a bullish price movement, which has already been seen for the NASDAQ and SNP500. Another point is the unemployment claims, which again were higher than expectations for a 3rd consecutive week. This can potentially indicate a need for defensive and high dividend yielding stocks.
European stocks are currently trading higher while oil prices trade lower. This can be seen as positive for stocks. Bond yields are higher on Monday but are retracing as the European Cash Open edges nearer. If yields do not increase further, the data will again indicate a potential upward price movement for the Dow Jones. Today investors will be looking to the Empire State Manufacturing Index. A higher-than-expected index can support the Dow Jones’ stocks.
Therefore, the price of the Dow Jones can potentially be trading below its value, for as long as interest rates cuts remain on the table. Though the index is likely to continue to lag behind the SNP500 and NASDAQ. The index is trading 3.75% lower than its 2024 highs and 1.50% lower than June’s highs. Investors are closely watching indication of upward price movement. Upward signals would indicate a possible rise to $38,714 for the short term. Currently the price is forming a bullish crossover on the 2-hour chart and the 5-minute chart. Buy signals are likely to materialize at $38,620.05 according to Fibonacci levels and $38,632.05.
NZDUSD – Why Is the New Zealand Dollar The Day’s Worst Performing?
The worst performing currency of the day is the New Zealand Dollar which has been depreciating for 3 consecutive days. The Dollar on the other hand is the best performing and starts the week with a 0.20% price gap in its favor. Investors are cautious about the upcoming release of New Zealand’s GDP release which has been poor over the past 2 quarters.
Poor macroeconomic statistics from New Zealand continues to put additional pressure on the currency. The May retail sales using electronic payment cards changed by –1.6% YoY after –3.8% previously and from –0.4% to –1.1% MoM. The country’s unemployment rate is currently at a 3-year high and is higher than that in the US. In addition to this, the country’s GDP Growth Rate has fallen over the past 2 consecutive quarters. The country will release their GDP Growth Rate for the latest quarter on Wednesday evening. Analysts expect a weak rise, but a further decline would push the economy into a recession.
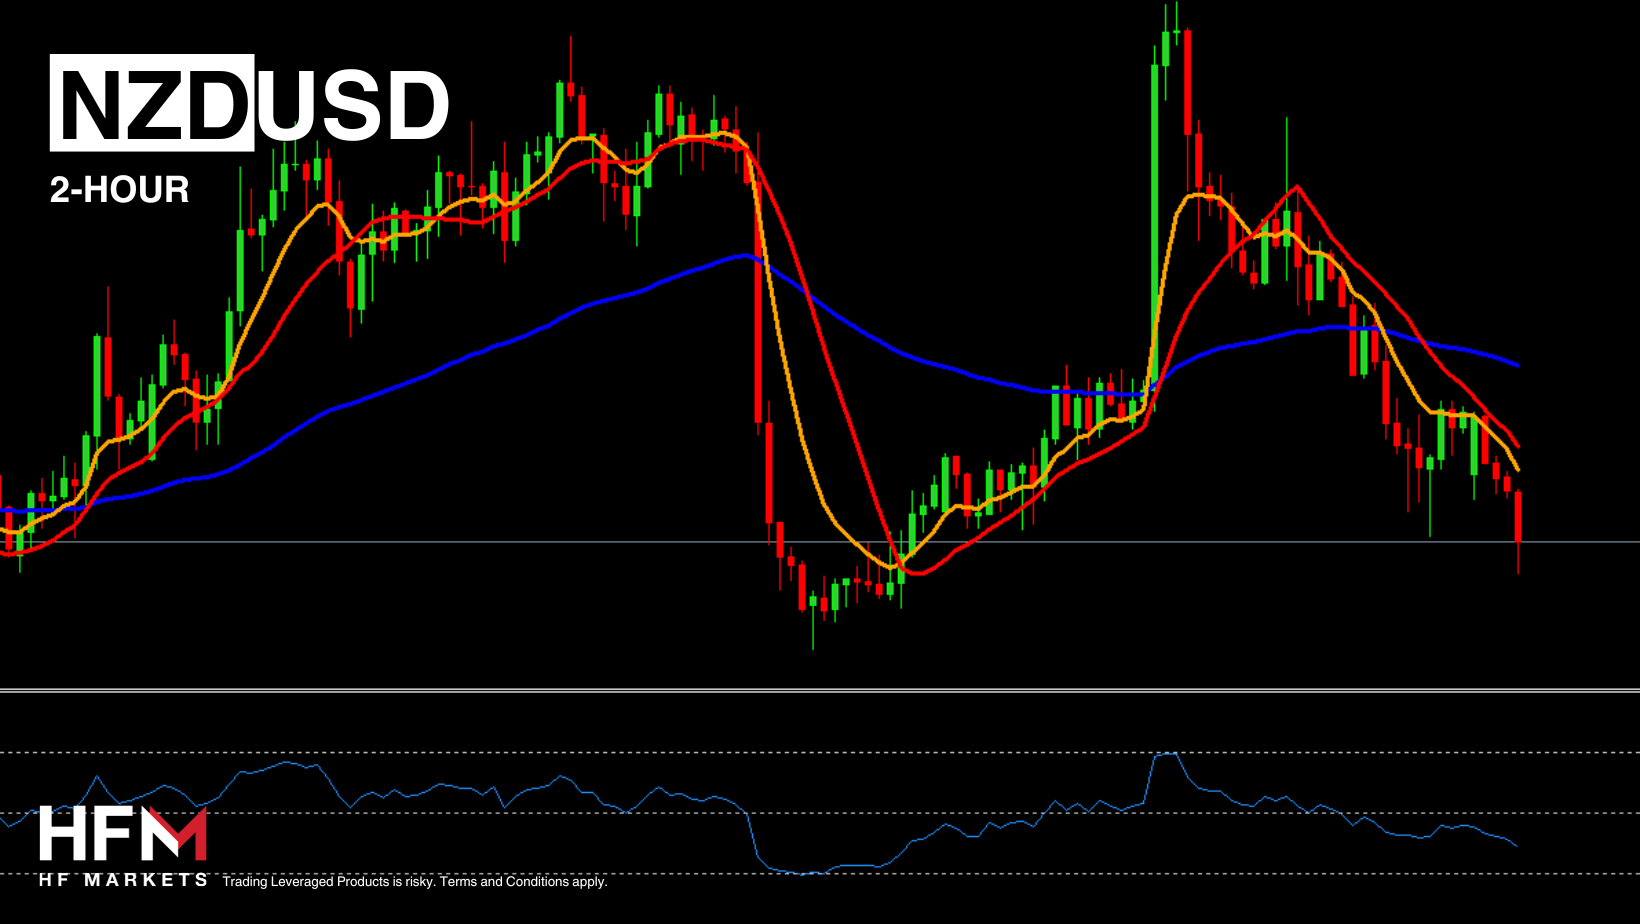
The US on the other hand will largely concentrate on this afternoon’s Empire State Manufacturing Index and tomorrow’s retail sales. Positive data is likely to support the US Dollar. The price is currently trading below the 75-bar EMA and the asset is forming bearish crossovers. Short term traders potentially may aim for the support level at 0.60915.
Market Analyst
Disclaimer: This material is provided as a general marketing communication for information purposes only and does not constitute an independent investment research. Nothing in this communication contains, or should be considered as containing, an investment advice or an investment recommendation or a solicitation for the purpose of buying or selling of any financial instrument. All information provided is gathered from reputable sources and any information containing an indication of past performance is not a guarantee or reliable indicator of future performance. Users acknowledge that any investment in Leveraged Products is characterized by a certain degree of uncertainty and that any investment of this nature involves a high level of risk for which the users are solely responsible and liable. We assume no liability for any loss arising from any investment made based on the information provided in this communication. This communication must not be reproduced or further distributed without our prior written permission.


