


Microsoft Corp., an American multinational technology conglomerate which actively engages in the development and support of software, services, devices and solutions, shall report its financial results for FY24 Q4 on 30th July. The company is currently ranked the world’s second most valuable company by market cap (approx. $3.3 trillion), just behind Apple. Inc (nearly $3.4 trillion).
Microsoft derives its revenues from three main segments. The first segment is Productivity and Business Processes, which includes products and services such as Office Commercial, Office Consumer, LinkedIn and Dynamic Business Solutions. The second segment is Intelligent Cloud, including various Server Products and Cloud Services, as well as Enterprise Services. The third segment is More Personal Computing, involving Windows, Devices, Gaming, Search and News Advertising.
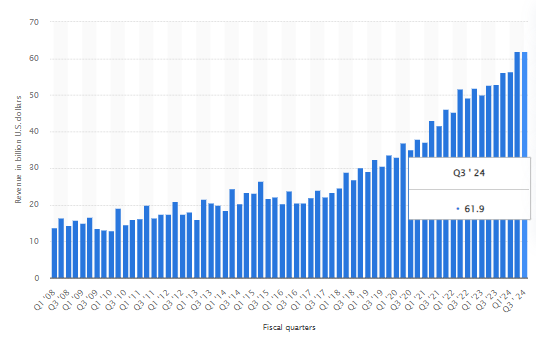
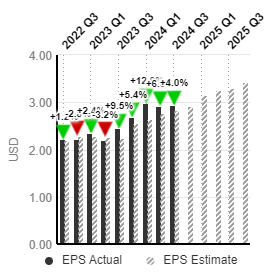
In general, Microsoft’s revenue in the previous quarter reached $61.9B, slightly down -0.19% from Q2 FY 24, but up 17% from the same period last year. The company’s quarterly revenue has quadrupled within the last twelve years. Based on these past data, the largest increase in quarterly revenue was more than $6B, which was seen between Q1 and Q2 2010.
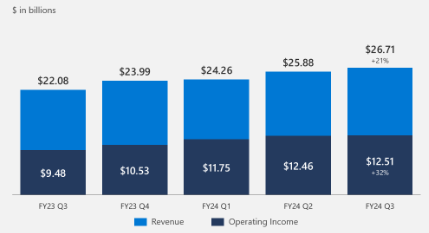
In the previous quarter, the Intelligent Cloud segment continued to be contributing the most to the company’s revenue, at $26.71B (+21% y/y). On the other hand, operating income grew 32% (y/y) to $12.51B. The company reported an improvement in Azure, inclusive of scaling of AI infrastructure, but partially offset by sales mix shift.
Productivity and Business Processes, on the other hand, reported $19.57B in revenue, up 12% from the same period last year, mainly driven by Office 365. The segment’s operating income grew 17% (y/y) to $10.14B.
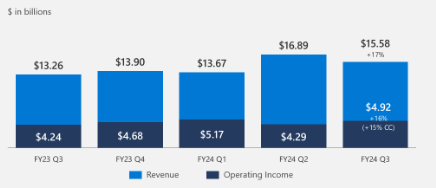
Lastly, More Personal Computing drove $15.5B (+17% y/y) in sales, boosted by net impact from the Activision Blizzard acquisition. Operating income was up 16% (y/y) to $4.95B. In fact, the acquisition has led to positive figures in Microsoft’s gaming revenues, as both Xbox hardware and Surface revenue tanked in the quarter. Following the launch of “AI PCs” powered by Qualcomm’s latest Snapdragon chips, the management is wishful that it could help to boost the Windows OEM revenues over the summer.
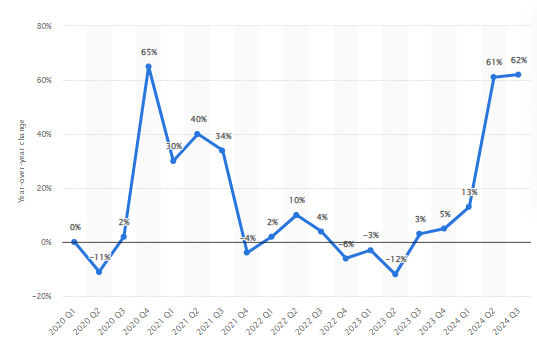
Revenues of Microsoft’s Xbox content and services reported a significant share of year-over-year growth in both Q2 and Q3 2024, buoyed by the closing of its acquisition of Activision Blizzard. In February, the company revealed that its Xbox Game Pass service has 34 million subscribers, a 36% leap from the figure reported more than two years ago.
Following price hikes on Xbox Game Pass recently, some industry analysts even predict that “there could be even more price hikes or new tiers appearing sometime in the future”, as Microsoft continues to pursue economic growth. A plan to release a mobile-focused version of Xbox Game Pass could potentially be a game-changer in improving the segment’s profitability.
In the coming quarter, the S&P Global Market Intelligence projected sales revenue to hit $64.4B, up 4.1% from the previous quarter and up 14.6% from the same period last year. However, operating income is expected to remain flat, at $27.6B, whereas net income is set to edge slightly lower from the previous quarter, towards $21.8B. Operating margin and net margin are expected to tick lower as well, at 42.84% and 33.91% respectively.
Technical Analysis:
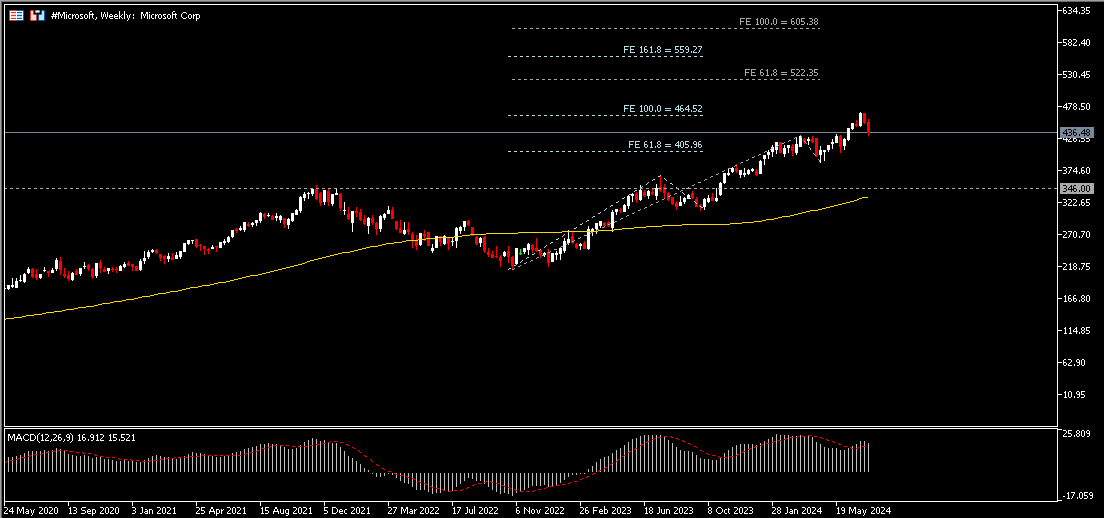
#Microsoft, Weekly: The Microsoft share price has recently retraced from resistance level $464.50. The overall trend remains upward, yet MACD indicator shows a diminishing bullish momentum. Further selling pressure may push the price lower towards the nearest support at $406. followed by $346. On the other hand, if support remains intact, a break above $464.50 may indicate trend continuation, towards the next resistance at $522 and $560.
Click here to access our Economic Calendar
Larince Zhang
Market Analyst
Disclaimer: This material is provided as a general marketing communication for information purposes only and does not constitute an independent investment research. Nothing in this communication contains, or should be considered as containing, an investment advice or an investment recommendation or a solicitation for the purpose of buying or selling of any financial instrument. All information provided is gathered from reputable sources and any information containing an indication of past performance is not a guarantee or reliable indicator of future performance. Users acknowledge that any investment in Leveraged Products is characterized by a certain degree of uncertainty and that any investment of this nature involves a high level of risk for which the users are solely responsible and liable. We assume no liability for any loss arising from any investment made based on the information provided in this communication. This communication must not be reproduced or further distributed without our prior written permission.


