


- The global stock markets turn red as all major indices significantly decline.
- The NASDAQ falls more than 6% on Monday and the NIKKEI225 wipes off all 2024’s gains.
- The US Unemployment Rate unexpectedly rises to 4.3% and the NFP figures fall to the lowest since February 2021!
- Warren Buffet opts for cash as he lowers exposure to equities, particularly Apple stocks and Bank of America.
- Markets turn to the traditional Safe Haven currencies. The Japanese Yen increases 3.36% and the Swiss Franc 1.61%.
USA100 – The NASDAQ Drops 6% On Monday!
The NASDAQ started the day with a bearish price gap measuring 0.85% and then fell a further 5.33%. This brings the best performing index of the past 3 years almost 17% lower than the most recent high and to its lowest price since April 25th, 2024. What is driving the bearish sentiment?
The decline is largely due to 3 factors which have triggered a risk-off sentiment. The first is the latest employment data from the US which indicates the US is likely to experience “economic weakness” for the rest of 2024. The US Unemployment Rate rose from 4.1% to 4.3%. 4.3% is considerably higher than the previous prediction of 4.1% and the 6-month average (3.9%). Another negative is the NFP figure fell to 114,000 which is the lowest since February 2021 and lower than market expectations. According to analysts, the data does not yet indicate a US recession but does signal stagnation. As a result, investor demand for the stock market is lower and shareholders are opting to cash in profits from the past 3 years.
The second factor is a rise in escalation in the Middle East. According to the US, Iran is likely to attack Israel at any time in retaliation to the killing of the Hamas leader while visiting Iran. However, it is not yet known how Iran will retaliate and what it would mean for peace in the region. Either way, a rise in tensions is bad news for the global stock market.
The third factor is Berkshire Hathaway which confirmed the company sold almost half of the Apple stocks they hold. In addition to this, the company continues to lower their exposure in Bank of America, selling almost 9% according to reports. The latest quarterly report also shows the company is increasing exposure to currencies and other sectors.
The question now is, what is the intrinsic value of the NASDAQ and when will investors buy the dip?
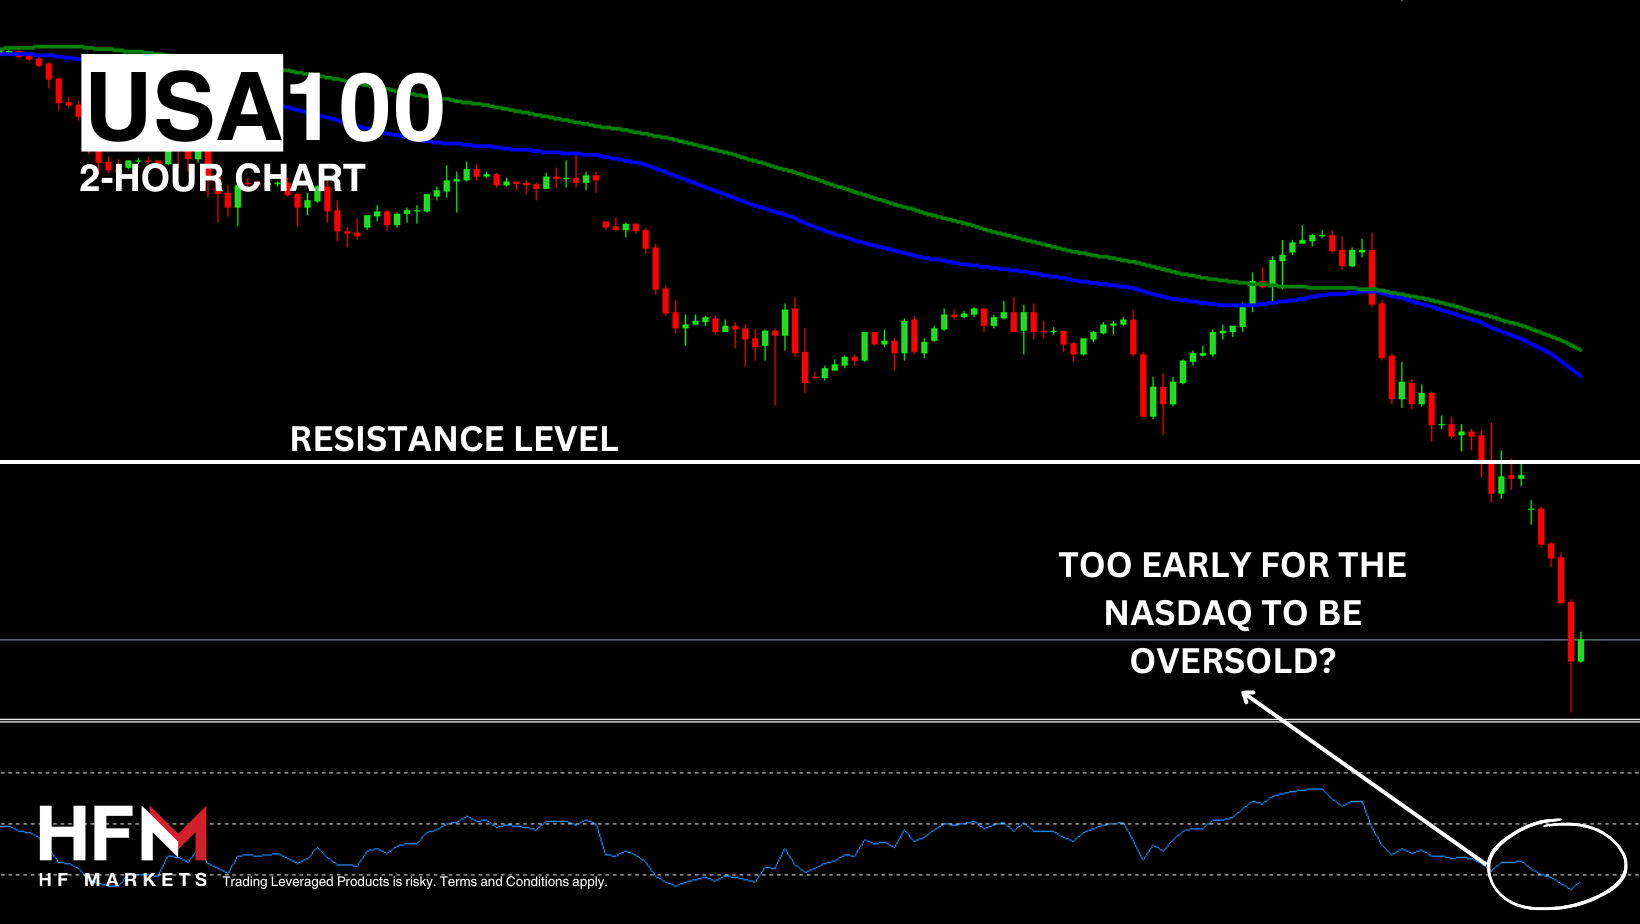 NASDAQ 2-Hour Timeframe With A 75-Period EMA & 100-Period SMA
Normally when the price of an index comes under significant stress but is not necessarily deemed as a stock market crash, investors will either look at the clearest support level or the 12-month average price. The support closest to the support level can be seen at $16,953.30 (3.34% lower than the current price.) The 12-month average is currently sitting at $17,133.00. However, until buyers reenter the market, trend indicators point towards a downward trend. The 5-minute timeframe using the Fibonacci Levels and Crossovers indicates strong sell trades if the price drops below $17,378.22.
However, buyers are only likely to re-enter if Middle East tensions calm and with better US economic data.
USDJPY – Will the Yen Be the Best-Performing Currency of Late 2024?
The Japanese Yen has been the best performing currency of the past month for two reasons. The first is the Bank of Japan’s unexpected interest rate hike and the second is the currency’s status as a Safe Haven asset. Over the past month the Japanese Yen has risen almost 12%. Many economists expect the currency to be one of the best performing of the second half of the year.
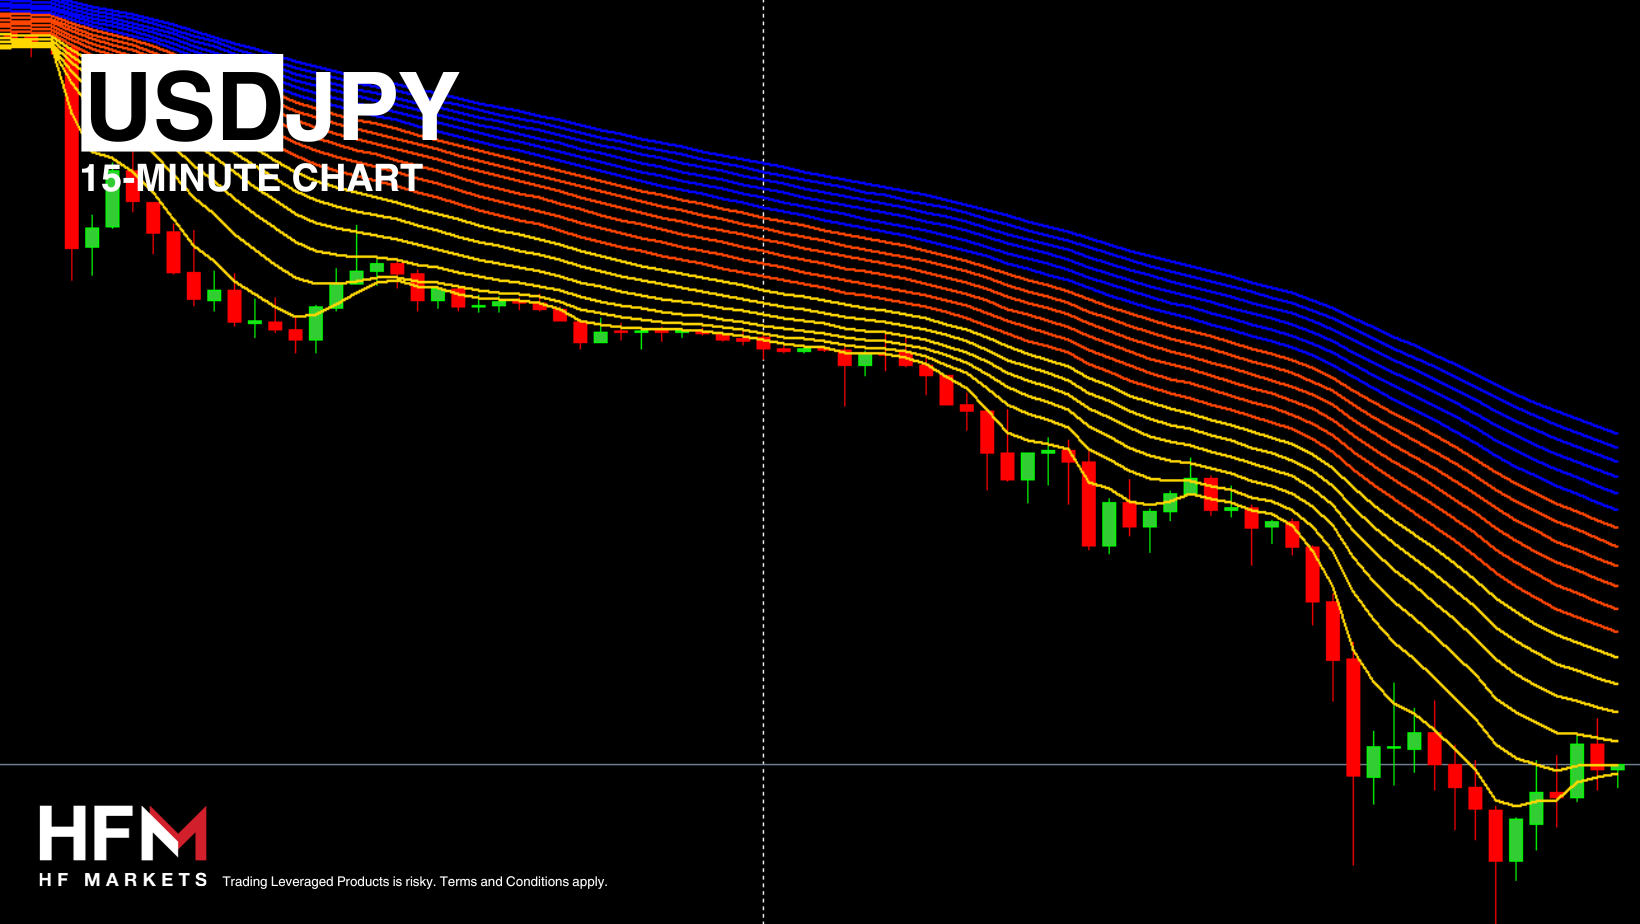 USDJPY 15-Minutes Chart With A 3-Zone Regression Channel
However, currently the USDJPY is oversold according to the RSI. Nonetheless, the current retracement may push the RSI high enough to no longer be oversold by the US session. The exchange rates continue to trade below the 75-Period Trendline and 100-Period SMA.
Michalis Efthymiou
Market Analyst
Disclaimer: This material is provided as a general marketing communication for information purposes only and does not constitute an independent investment research. Nothing in this communication contains, or should be considered as containing, an investment advice or an investment recommendation or a solicitation for the purpose of buying or selling of any financial instrument. All information provided is gathered from reputable sources and any information containing an indication of past performance is not a guarantee or reliable indicator of future performance. Users acknowledge that any investment in Leveraged Products is characterized by a certain degree of uncertainty and that any investment of this nature involves a high level of risk for which the users are solely responsible and liable. We assume no liability for any loss arising from any investment made based on the information provided in this communication. This communication must not be reproduced or further distributed without our prior written permission.


