


Broadcom, which is generally known as the “top leader” in the semiconductor industry (market cap over $750B, ranked 11th in the world) and is involved in designing, developing and supplying semiconductors and infrastructure software solutions, shall release its earnings report for the fiscal quarter ending July 2024 on 5th September (Thursday), after market close.
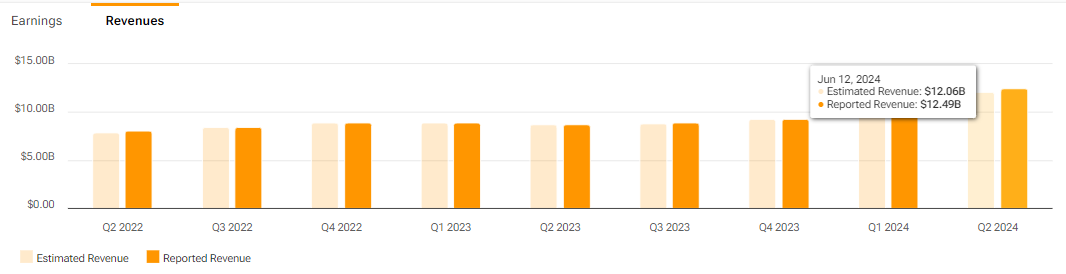
Broadcom reported revenue of $12.49B in the previous quarter, up 4.4% from Q1 2024, and up over 43% from the same period last year. The result was mainly driven by AI demand and VMware. By segment, Semiconductor solutions reported revenue $7.2B, up 6% (y/y), whereas Infrastructure Software saw a massive leap of 175% (y/y) to $5.3B. Net income was reported at $2.1B, down -39% from the same period last year. The company also reported a decrease in profit margin to 17% (was 40% in Q2 2023), dragged by higher expenses.
Nevertheless, there could be massive potential hidden within this company, which might be overlooked by market participants as most are already eyeing another tech conglomerate, Nvidia. The competitive strengths of Broadcom include the company being the key supplier of networking solutions – the introduction of Jericho3-AI last year is said to be the highest performance fabric for AI networks, connecting up to 32,000 GPUs in high-compute data centers. In the next five years, Broadcom sees a cumulative AI silicon revenue over $150B, across four to five major AI customers – which makes up 30%-40% annual growth rate in AI semiconductor revenues.
Apart from that, Broadcom’s relentless innovation has led to the company dominating the data center networking chips, with 80% market share and 60% in ASICs for AI. Through fiscal 2025, it is anticipated that Broadcom’s non-GAAP EPS to grow 24% (y/y), with anticipated market growth of networking chips and AI chips annually at 25% and 24%, respectively. Fundamentally, Broadcom could serve a better alternative in tech stocks following its lower valuation based on forwards earnings ratio, in addition to its favourable long-term prospects.
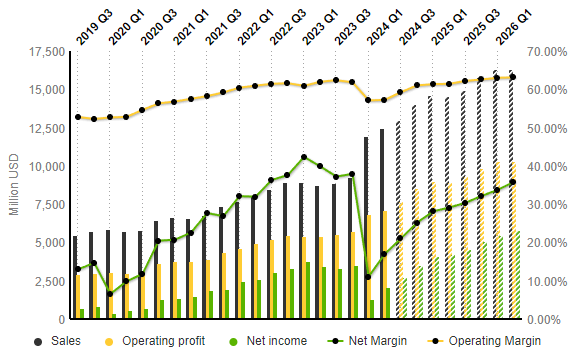
According to projections by S&P Global Market Intelligence, sales revenue is expected to reach $13.0B in the coming quarter, up 3.8% from the previous quarter, and up 46% from the same period last year. Operating profits are projected to hit $7.7B, while net income is also expected to increase towards $2.7B, both were $7.1B and $2.1B in the previous quarter. Operating margin is expected to edge slightly higher towards 59.27%, previously 57.23%; Net margin, on the other hand, is expected to increase to 21.03%, previously 16.99%.
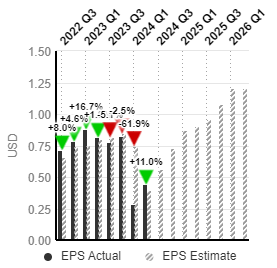
EPS is estimated to hit $0.56, up 12 cents from the previous quarter. It was $0.77 in Q3 2023.
Technical Analysis:
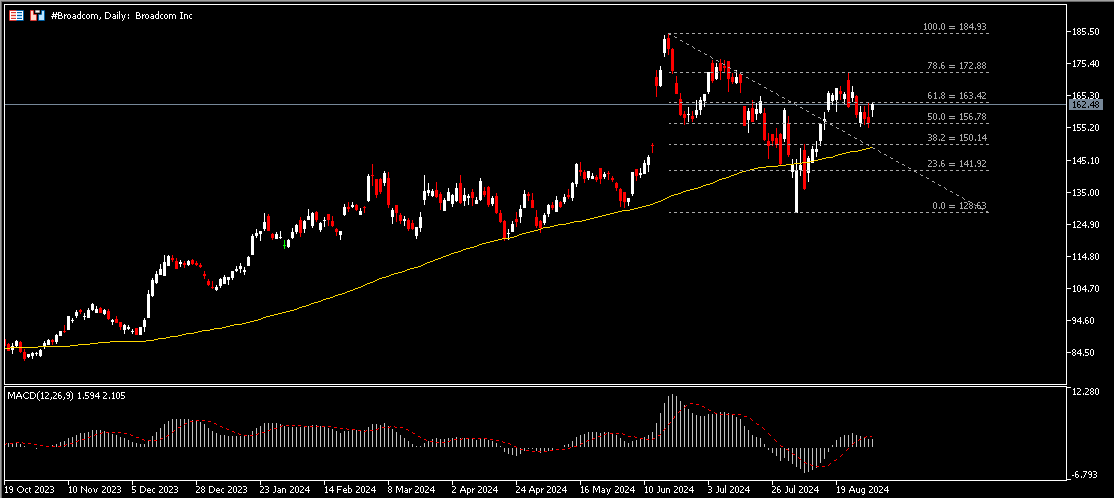
#Broadcom, Daily: The company share price remains traded in an uptrend, following a rebound from false break at support $142 (FR 23.6% extended ATH to the lows in early August). It is currently testing the nearest resistance $163.50 (FR 61.8%). A close above this level may encourage the bulls to continue testing the next resistance at $173 (FR 78.6%). On the other hand, a breakout at support $157 (FR 50.0%) shall complicate the whole picture that may indicate price consolidation, with the next support at $150 (FR 38.2%) that intersects with the 100-day SMA.
Click here to access our Economic Calendar
Larince Zhang
Market Analyst
Disclaimer: This material is provided as a general marketing communication for information purposes only and does not constitute an independent investment research. Nothing in this communication contains, or should be considered as containing, an investment advice or an investment recommendation or a solicitation for the purpose of buying or selling of any financial instrument. All information provided is gathered from reputable sources and any information containing an indication of past performance is not a guarantee or reliable indicator of future performance. Users acknowledge that any investment in Leveraged Products is characterized by a certain degree of uncertainty and that any investment of this nature involves a high level of risk for which the users are solely responsible and liable. We assume no liability for any loss arising from any investment made based on the information provided in this communication. This communication must not be reproduced or further distributed without our prior written permission.


