


- Gold trades 16.00% higher in 2024 as economists predict the Federal Reserve will cut between 75 and 100-basis points.
- The price of Gold is at a clear trend line and rebounds at the opening of the European Trading Session.
- Economists advise that for Gold to continue to increase to $2,600 and above, the market would require the Federal Reserve to cut 1.00%.
Gold (XAUUSD) – Will Gold Rise To $2,600?
Gold has risen 16.00% so far in 2024, largely driven by the geopolitical tensions and fear of lower consumer demand, but primarily due to expectations of lower interest rates. Analysts expect the Federal Reserve to adjust the Federal Fund Rate by 0.75%. However, volatility will increase if the Fed opts to adjust at a faster or slower rate.
According to economists, in order for Gold to increase up to $2,600-$2,700, the Federal Reserve will need to increase the size of the rate cuts. According to the CME Group, there is a 45% chance, the Fed will cut 1.00% by 2025. If this possibility increases throughout the week, the price of Gold is likely to decrease as the Dollar declines. In order for the Federal Reserve to become more dovish, the regulator would look for weaker employment data and lower inflation.
Throughout the day, the price of Gold will depend on the price movement of the Dollar as well as the ISM PMI release at 14:00 GMT. However, another key release will be tomorrow’s JOLTS Job Openings. Analysts expect the job vacancies are likely to fall from 8.18 million to 8.09 million, one of the lowest in the past 2-years. If both the PMI data and job vacancies read lower, Gold will potentially increase in value. This is due to markets expecting a higher rate cut and weakening demand. Therefore, Gold will gain higher demand as an alternative to the Dollar and its safe haven status.
Technical Analysis – Gold
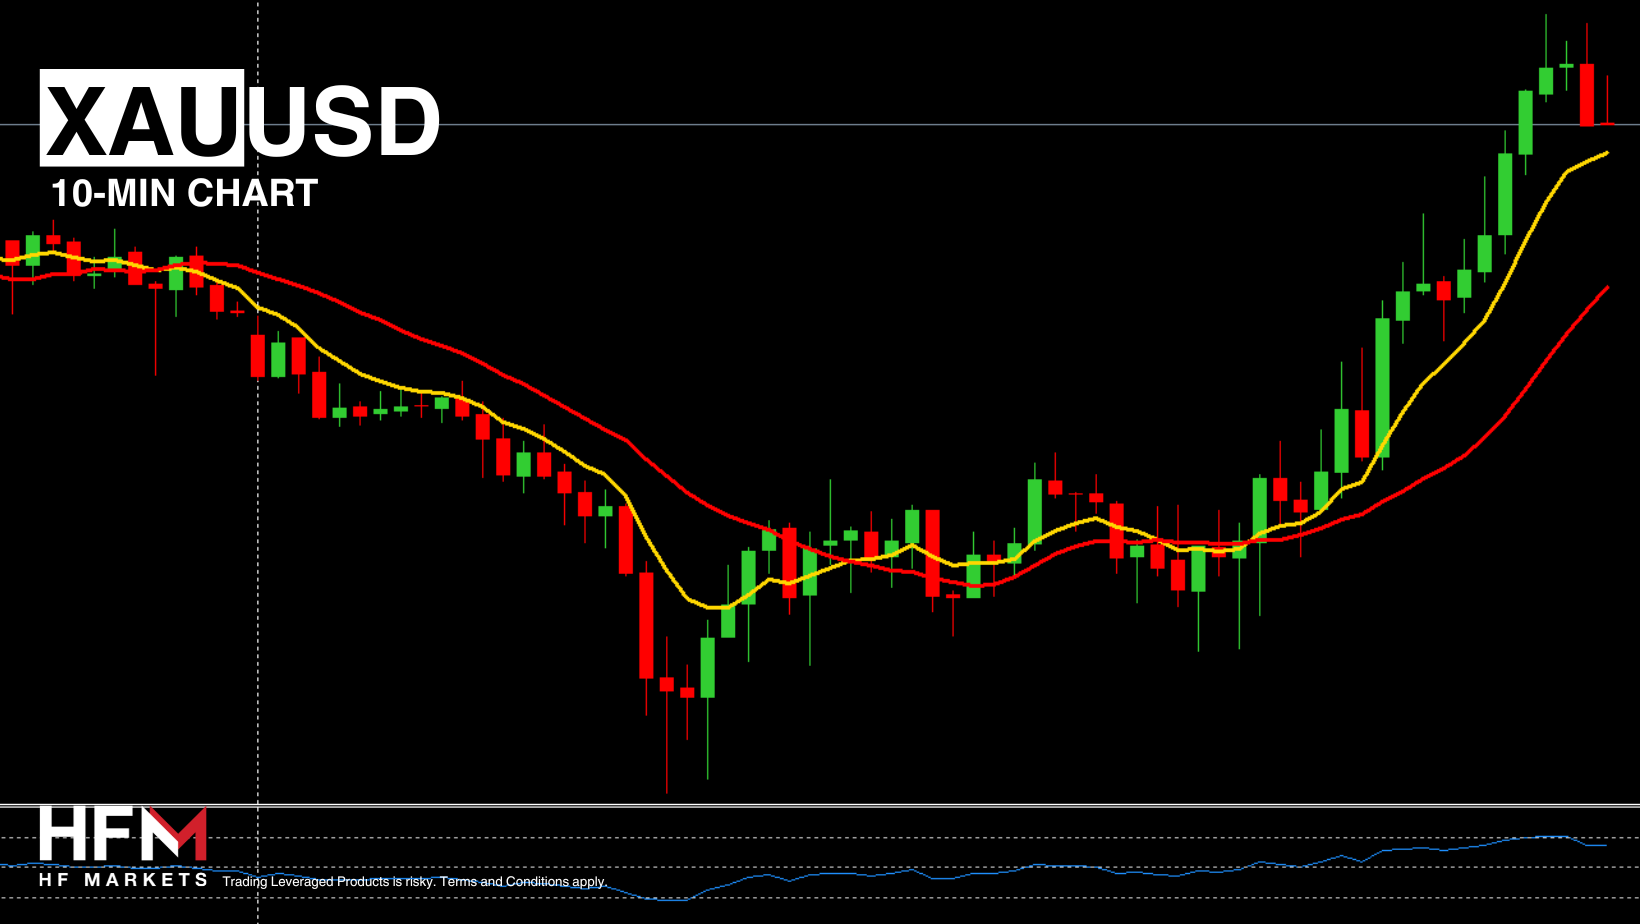 XAU/USD 10-Minute Chart on September 3rd
On the 4-hour chart, investors can clearly see the price is forming a range between the $2,529 and $2,492 level. The asset has largely found support and resistance at these levels as the market believes the asset is trading at its intrinsic value. However, the upcoming employment and inflation data can potentially change the market pricing. As the price continues to attempt to break through the resistance level at $2,529, the resistance level is losing its psychological edge over buyers. This makes it easier to break through.
On the 2-hour timeframe, the price is trading below the 75-Period EMA and 100-Period SMA. If the price rises above these levels, buy signals become more attractive. On the 10-Minute chart the asset has formed a bullish crossover and a higher high indicating bullish price movement. However, the price is overbought on the RSI. If the PMI data reads lower than expectations, the data will move hand in hand with the crossover signal.
Click here to access our Economic Calendar
Michalis Efthymiou
Market Analyst
Disclaimer: This material is provided as a general marketing communication for information purposes only and does not constitute an independent investment research. Nothing in this communication contains, or should be considered as containing, an investment advice or an investment recommendation or a solicitation for the purpose of buying or selling of any financial instrument. All information provided is gathered from reputable sources and any information containing an indication of past performance is not a guarantee or reliable indicator of future performance. Users acknowledge that any investment in Leveraged Products is characterized by a certain degree of uncertainty and that any investment of this nature involves a high level of risk for which the users are solely responsible and liable. We assume no liability for any loss arising from any investment made based on the information provided in this communication. This communication must not be reproduced or further distributed without our prior written permission.


