Commodity Currencies, Daily
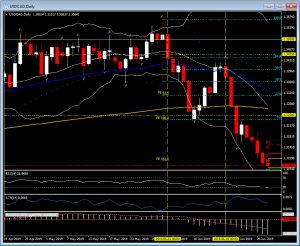
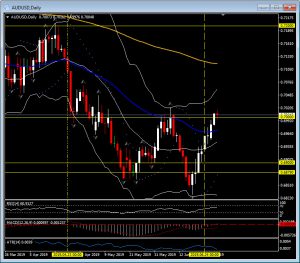
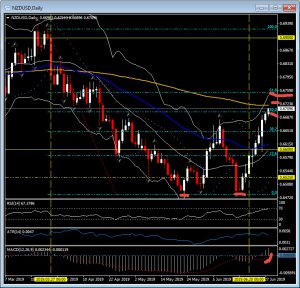
As week, month, quarter and half year all conclude, the key commodity currencies have all breached key psychological levels today. USDCAD has slipped under 1.3100, AUDUSD has broken 0.7000 and NZDUSD has broken 0.6700.
The Loonie has had a strong month on the back of the rising Oil price. Technically USDCAD last breached the 20-day moving average back on June 3, (1.3435) and despite retracing to this key level mid-month, has since turned lower again breaching 1.3300, 1.3200 and 1.3100. It is down for a fifth consecutive day and what is now the third weekly decline out of the last four weeks, today printing a new trend low (so far) at 1.3085 and the key 161.8 Fibonacci extension. That is the lowest level seen since late January. The new low reaffirms the bear trend that’s been unfolding since early May. There could be further downside bias if the Fed remains on its overall dovish course and US-Iran tensions remain elevated, which should in turn keep oil prices underpinned. Next Support sits at 1.3050 and Resistance at 1.3170. The 200-day moving average is some significant distance away at 1.3260 and the RSI has reached the oversold zone, trading under 30.00.
The Aussie only breached the 20-day moving average this week. However, it has followed through, rising for its ninth consecutive day and trading over the previous resistance of the 50-day moving average. 0.7000 is a key level for AUDUSD, RSI is 60 and rising and with the MACD looking to close the month over the 0 Line for the first time since April 23, momentum appears to be with the AUD.
The Kiwi has had a volatile week following the RBNZ decision to leave rates unchanged on Tuesday. However, once again the momentum has rallied into month-end. Following a prolonged move down, the NZDUSD bounced from a double bottom low at 0.6490 after last week’s announcement from the FOMC. The move stalled ahead of the RBNZ, at the 38.2 Fibonacci level and key round number at 0.6550. A breach of the June high at 0.6680 has seen further moves to the 50.0 Fibonacci and 200-day Moving Average resistance zone at 0.6700-20. Support sits at the 50-day moving average and psychological 0.6600 and 0.6525.
Click here to access the Economic Calendar
Stuart Cowell
Head Market Analyst
Disclaimer: This material is provided as a general marketing communication for information purposes only and does not constitute an independent investment research. Nothing in this communication contains, or should be considered as containing, an investment advice or an investment recommendation or a solicitation for the purpose of buying or selling of any financial instrument. All information provided is gathered from reputable sources and any information containing an indication of past performance is not a guarantee or reliable indicator of future performance. Users acknowledge that any investment in Leveraged Products is characterized by a certain degree of uncertainty and that any investment of this nature involves a high level of risk for which the users are solely responsible and liable. We assume no liability for any loss arising from any investment made based on the information provided in this communication. This communication must not be reproduced or further distributed without our prior written permission.


