


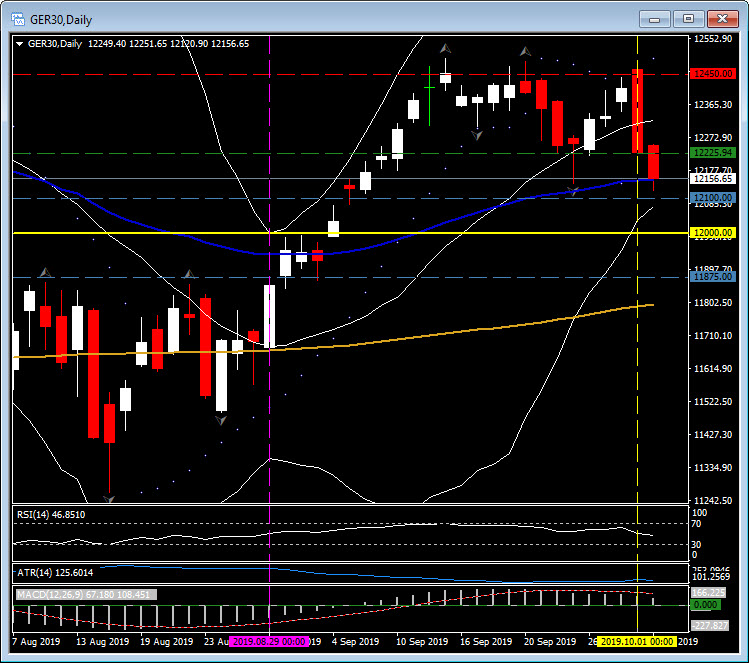
GER30, H1
The US ISM fell sharply to a 47.8 new expansion-low in September from a 3-year low of 49.1 in August, leaving a second consecutive reading in the sub-50 contraction zone. The prior expansion-low was 48.0 in January of 2016. The jobs index fell to 46.3 from 47.4 in August, leaving the lowest reading since the 44.6 expansion-low in January of 2016. The weakness may reflect a late-September hit from the UAW-GM strike of 49k workers starting on September 16. The ISM defied the stablization in the components of most sentiment surveys for September. The data yesterday contributed to the erratic swings we’ve seen in all the soft-data measures in 2019, like due to competing perspectives on the trade war, troubles abroad, and stock price gyrations. Despite the drop, the ISM-adjusted September average of the major sentiment surveys will likely sustain the August rise to 53 from a 52 recent-low in July. The index sat at 53 in June and 54 over the prior six months, following a winter pullback from 59 cycle-highs in four of the five months through September.
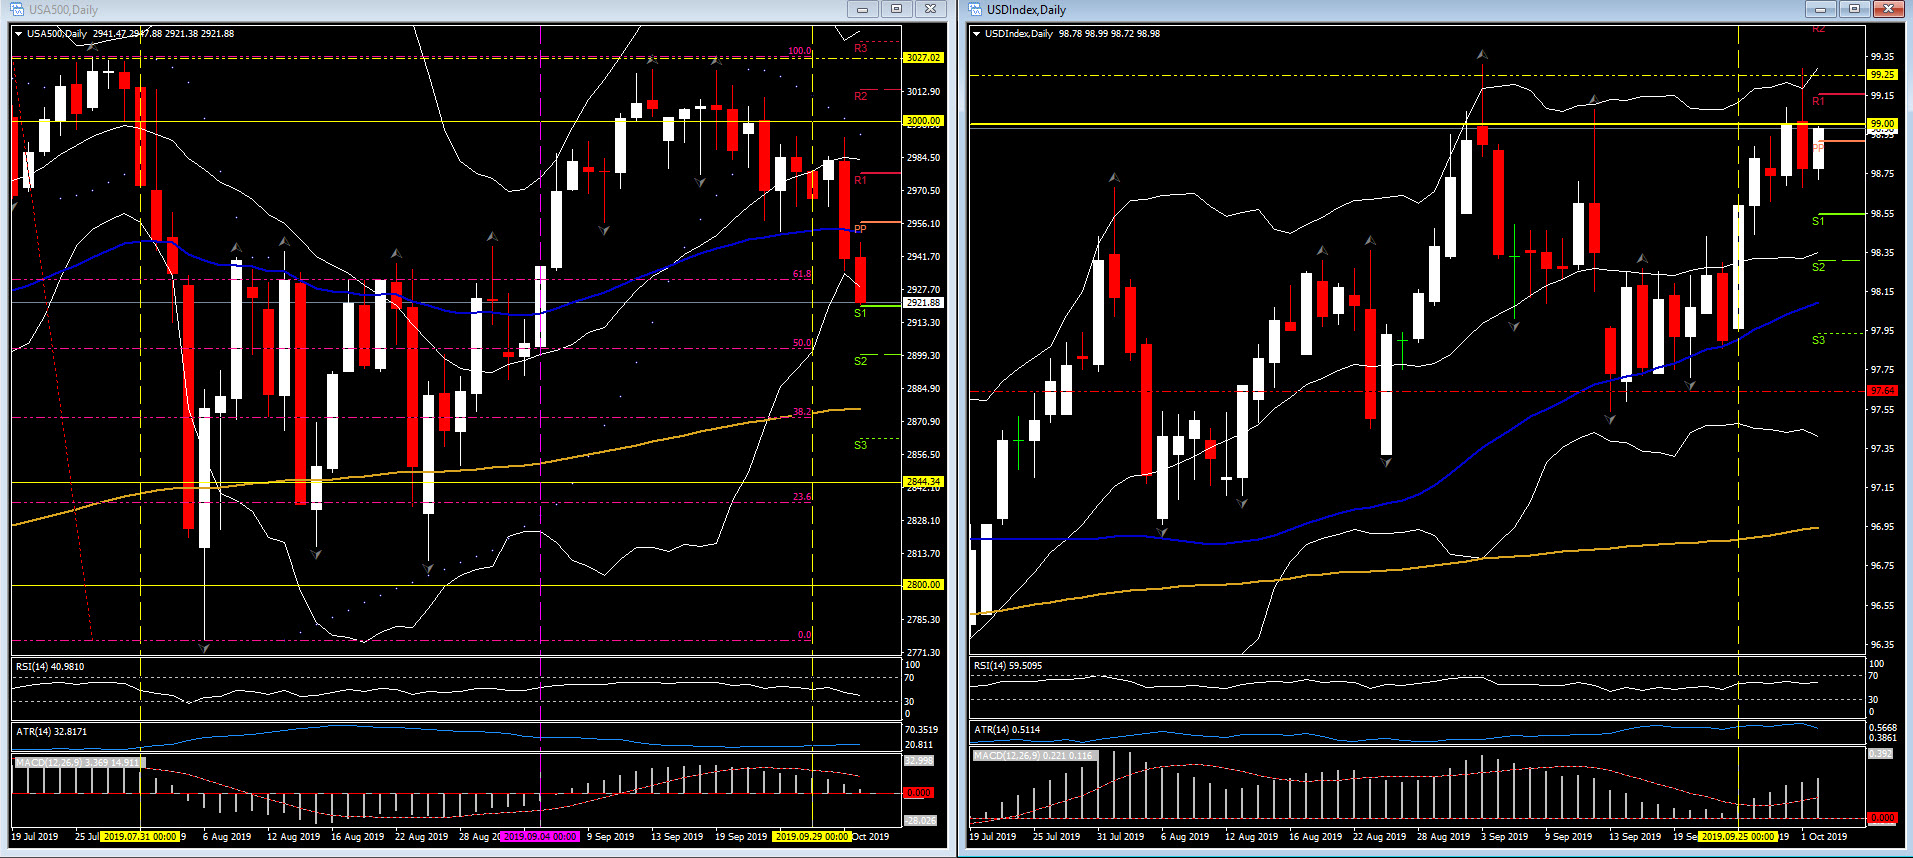
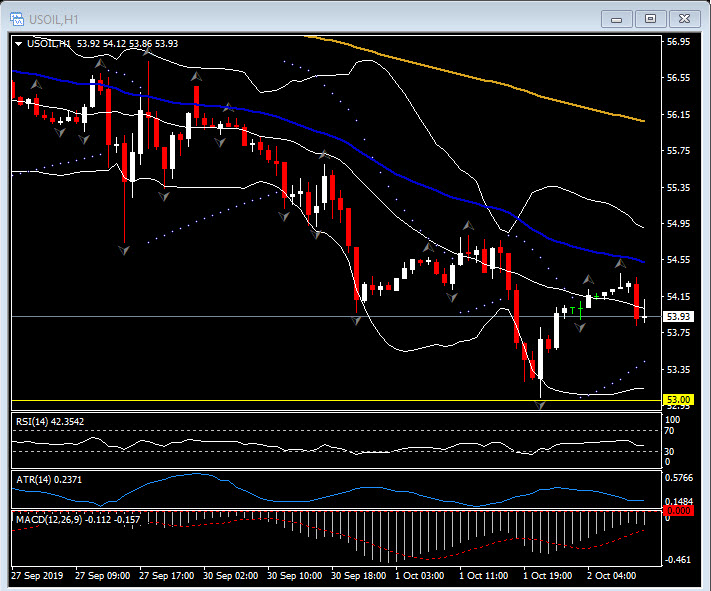
Global equity markets, oil prices and the USD all took a tumble following the surprise data from the ISM. The USA500 fell 1.2% (2940) into the close yesterday with Futures continuing to weaken to 2930 today. The rally in the USDIndex reversed sharply from 99.25 but remains bid today as it holds 98.75. USOil traded within a few cents of $53.00 before recovering to $54.00 following a surprise fall in inventories from the API and the official EIA inventories later today are expected to show a build of 2 million barrels this week.
The GER30 has continued to lead European equities lower today after a breach and break of the key 20-day moving average yesterday triggering a short position for the Daily trend following strategy, (Entry 12,225, T1 12100, T2 12,000 and T3 11,875, with initial stop loss at 12,450). The Crossing EMA Strategy (H1) triggered at 15:00 GMT yesterday (12,280) using Option 1 (a maximum of 3 consecutive trades if the trend remains intact) it generated T1 at 12,247 (+33 points), T2 12,212 (+35 points) with T3 at 12,108 from the entry at 08:00 GMT today at 12,147.
Click here to access the Economic Calendar
Stuart Cowell
Head Market Analyst
Disclaimer: This material is provided as a general marketing communication for information purposes only and does not constitute an independent investment research. Nothing in this communication contains, or should be considered as containing, an investment advice or an investment recommendation or a solicitation for the purpose of buying or selling of any financial instrument. All information provided is gathered from reputable sources and any information containing an indication of past performance is not a guarantee or reliable indicator of future performance. Users acknowledge that any investment in Leveraged Products is characterized by a certain degree of uncertainty and that any investment of this nature involves a high level of risk for which the users are solely responsible and liable. We assume no liability for any loss arising from any investment made based on the information provided in this communication. This communication must not be reproduced or further distributed without our prior written permission.


