


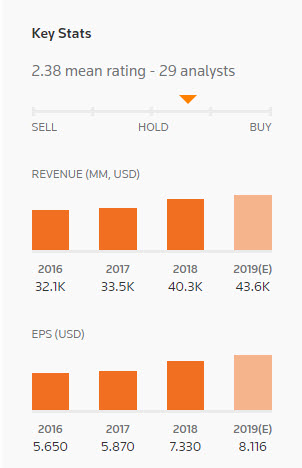
American Express’ third Quarter earnings for 2019 will be reported before the US Market opens today. The consensus recommendation for the company is “neutral to buy” corresponding to the majority of the consensus recommendation for the Online Services peer group , as 15 out of 29 Analyst Firms recommend remaining on hold and 13 suggest “Buy” possibility.
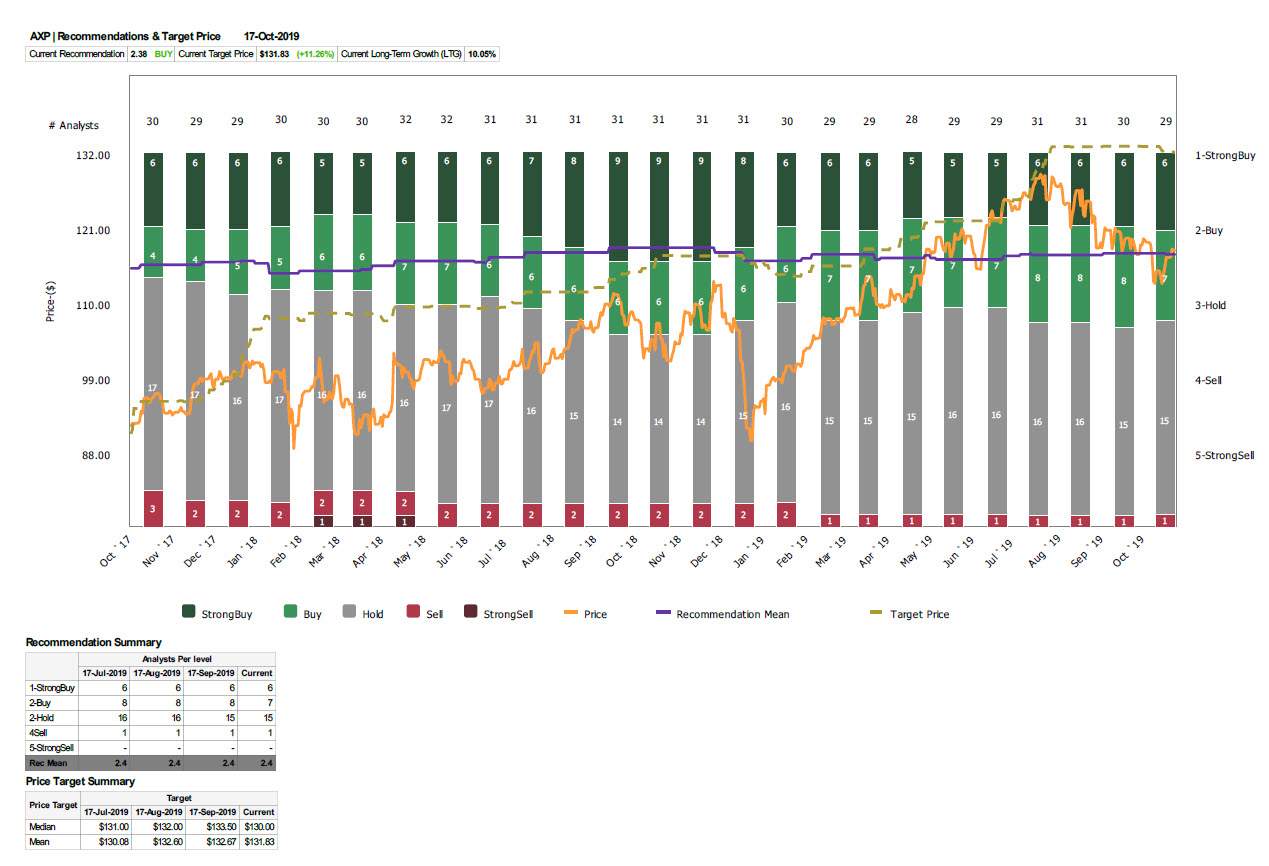
Figure 1: Data Provider: Data is provided by Reuters
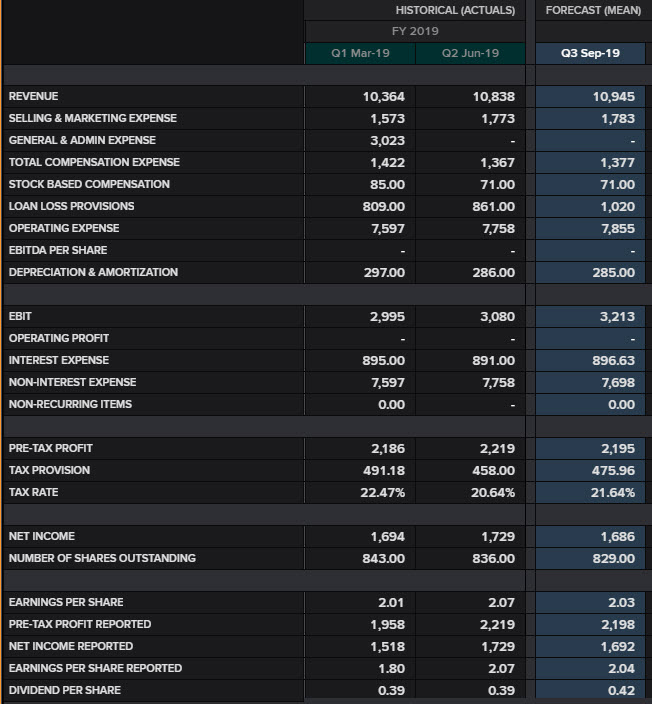
The company is expected to report $2.03 and $2.07 earnings per share this quarter, according to Thomson Reuters Eikon and Zacks Investment Research. This represents a yearly change of 8-10% for Q3 2018, and a reduction over the past month from 2.08. The Revenues number is projected to climb 7.9% year over year to hit $10.945 billion. In contrast with the last quarter, earnings should decrease from a possible revenue grow in each of the company’s three segments, i.e. Global Consumer Services Group, Global Commercial Services and Global Merchant and Network Services.
The growth of revenue is anticipated to be positively driven by a global rise in loans, card fees (as most newly-issued cards carry an annual fee) and the higher worldwide Card Member spending.
Also the company’s strategy could likely continue to positively affect the third quarter earnings report.
 The company’s strategy contains:
- Growing of the Business to Business (B2B) payment offering by expanding the network of its strategic partnerships with providers like Amazon Business, Tradeshift, SAP Ariba, Wax, MineralTree and others.
- Driving scale by obtaining a number of digital entities, in order to exploit the digital and mobile payment platform.
Based on the above strategic steps, the AMEX has managed to impel its clients on using the AMEX app on a regular basis. This could benefit the overall revenue growth, as the breakdown could show a rise in spending and lending from card members.
Other than the above, the American Express Company (NYSE: AXP) announced, in September, the repurchase of up to 120 million common shares. “This authorization replaces the 41 million shares of common stock remaining from the previous board authorization in 2016.”
Currently the company has 832 million shares outstanding, while so far this year it has managed to buy back up to 28 million shares. This buyback program could boost AMEX stock price as in general a return of capital to shareholders could help both shareholders and the company. Buybacks may be beneficial to a company to repurchase its shares, including ownership consolidation, undervaluation, and boosting its key financial ratios. In terms of finance, buybacks can boost shareholder value and share prices while also creating a tax-advantageous opportunity for investors.
It is widely expected that American Express is likely to beat quarterly earnings. The company has an impressive earnings history, as it has succeeded to beat estimates 10 out of 12 times since 2017. If the company achieved accuracy with its forecast this time as well, then a positive earnings outcome without any negative surprises on revenue could attract bulls back into the market, after 3 weeks of decline due to higher yields.
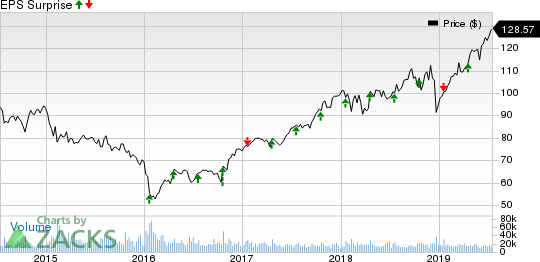
Figure 2: Data Provider: Data is provided by Zacks Investment Research.
After the drop by nearly 13% seen in Q2, the American Express share price is currently gaining up to 27% for 2019. The asset is trading as high as $119.00 today, $9 below year’s peak.
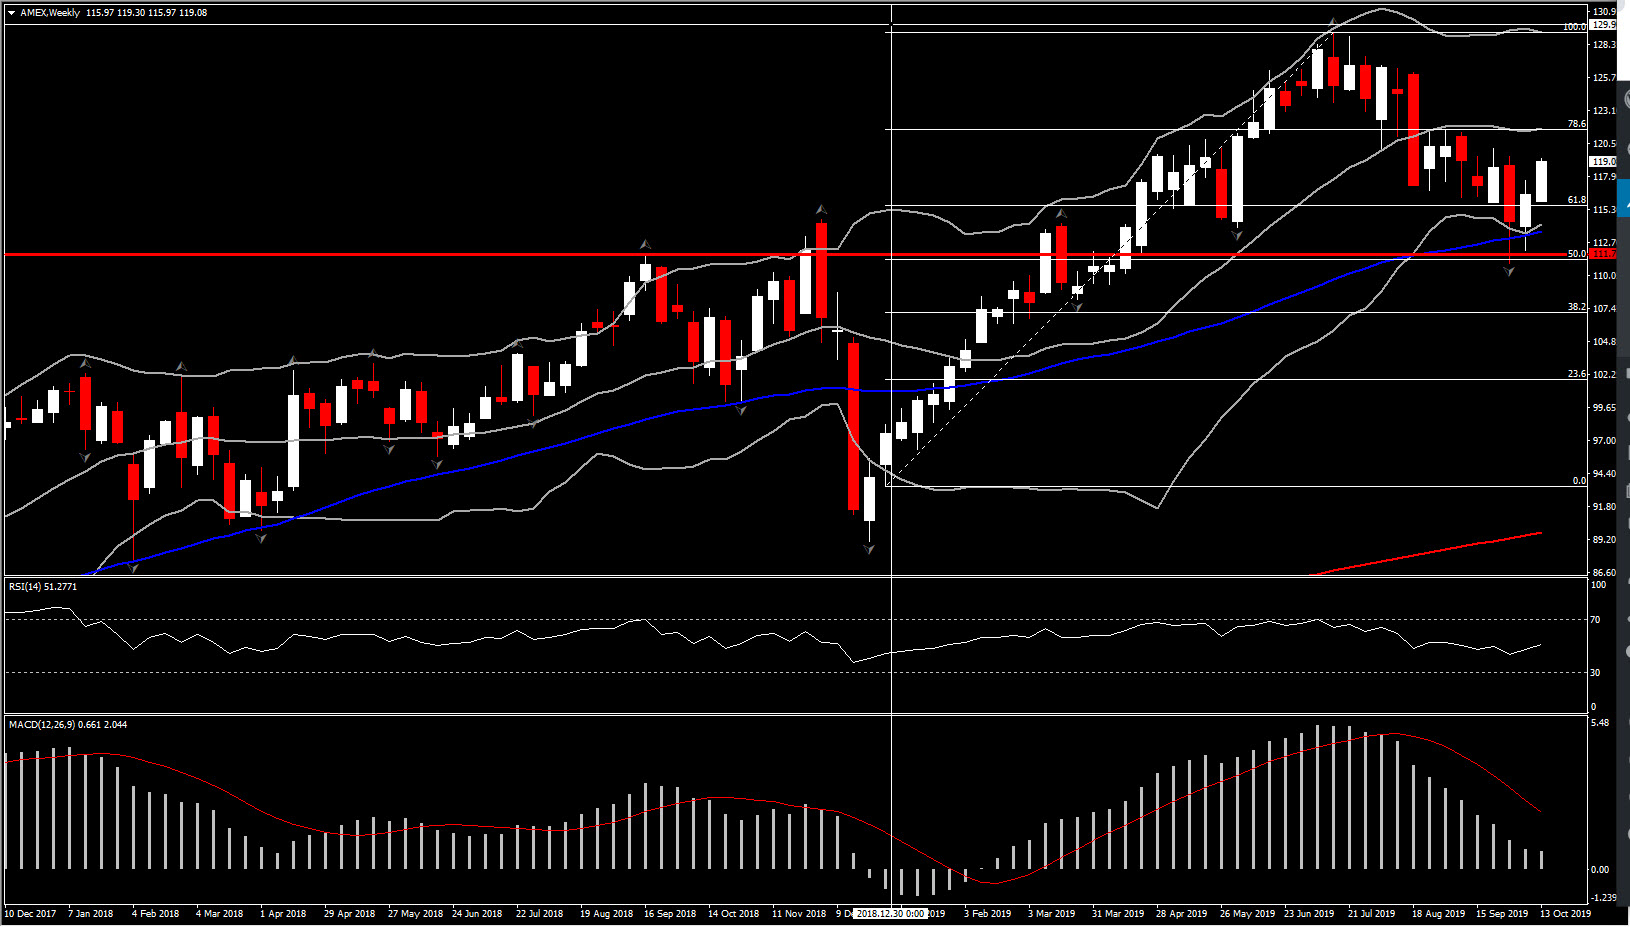
A healthy financial report today could shift the attention further to the upside at year’s highs. The 50% Fibonacci level at 111.35 and the 50-week SMA, at 113.60 (the asset is supported by 50-week SMA since February 2019), could provide strong Support area for the asset, in case of an extension lower for AMEX price, prior to the earnings announcement or even disappointing earnings outcome. A break below Q2 low could find Support at 38.2% Fib. level $107.40.
However, a continuation of the price northwards could find Resistance at $121.50-$126.30 which is between the confluence of 20-week SMA and the 78.6% Fibonacci (set from year’s low in January up to year’s high in July) and the 61.8% Fib. level from Q2 decline. Further gains above the latter could retest 128 area.
Click here to access the Economic Calendar
Andria Pichidi
Market Analyst
Disclaimer: This material is provided as a general marketing communication for information purposes only and does not constitute an independent investment research. Nothing in this communication contains, or should be considered as containing, an investment advice or an investment recommendation or a solicitation for the purpose of buying or selling of any financial instrument. All information provided is gathered from reputable sources and any information containing an indication of past performance is not a guarantee or reliable indicator of future performance. Users acknowledge that any investment in Leveraged Products is characterized by a certain degree of uncertainty and that any investment of this nature involves a high level of risk for which the users are solely responsible and liable. We assume no liability for any loss arising from any investment made based on the information provided in this communication. This communication must not be reproduced or further distributed without our prior written permission.


