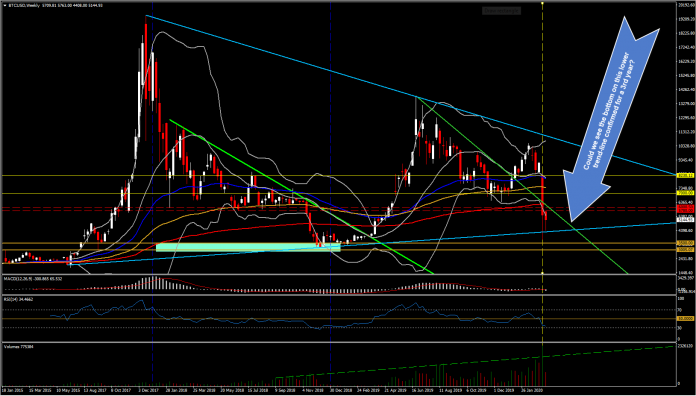
Cryptocurrencies could not remain outside the global selloff, with BTCUSD reaching $3,762.50 lows on Friday the 13th, while this week they keep dancing on the lower barrier of the 3-year Falling Channel. This week, Bitcoin has been trading at less than 40% of its 2019 peak value, with continuously increasing volatility.
Similar to nearly all the other USD crosses, selling has reportedly been prompted by attempts to raise USD cash to cover leveraged investors in other losing asset classes, namely equities. As Allianz’s chief economic adviser, Mohamed El-Erian, said on CNBC “When people cannot sell what they want to sell, they sell what they can sell.”
The key question is whether Bitcoin and in general the cryptocurrency market will continue gripping from stocks’ performance and hence whether this roller-coaster decline will continue further.
Technically speaking, despite the sharp drop, BTCUSD has been keeping a floor so far at around the $3,500 -$4,300.00 level, at the triangle’s lower hurdle. The sustainment of this floor could alert the stop of the sell off for cryptos, however for now this looks unlikely, as the break of the key $6,000 level along with the spike seen in volume support the negative medium and long term outlook.
Interestingly, the largest volume spikes seen prior to 2020 were in the mid of October 2018 and August 2019, which both showed a lot of selling pressure, overwhelmed by bears. The volume was falling till the end of 2019, however with the start of the new year, it turned northwards again posting new highs as price has been falling.
This indicates that sellers require decreasing numbers and increasing enthusiasm in order to keep pushing prices lower. Theoretically, a price drop on a large volume is a stronger signal that something in the stock has fundamentally changed. Hence this could suggest that the price might fall further with the next Support at $3,500-$2,911.00 (at 2018 and October 2017 lows).
Momentum indicators suggest as well that the bearish rally has not reached an end yet, with weekly momentum indicators bearish but not yet oversold, pointing to more weakness in the near future. The daily momentum indicators are sloping negatively, looking oversold, however MACD’s extended lines into the negative area, along with the significant cross of the 50-day EMA below 200-day EMA (something similar to the well known death cross), strengthen the potential increase of the bearish sentiment in the medium term.
Click here to access the HotForex Economic Calendar
Andria Pichidi
Market Analyst
Disclaimer: This material is provided as a general marketing communication for information purposes only and does not constitute an independent investment research. Nothing in this communication contains, or should be considered as containing, an investment advice or an investment recommendation or a solicitation for the purpose of buying or selling of any financial instrument. All information provided is gathered from reputable sources and any information containing an indication of past performance is not a guarantee or reliable indicator of future performance. Users acknowledge that any investment in Leveraged Products is characterized by a certain degree of uncertainty and that any investment of this nature involves a high level of risk for which the users are solely responsible and liable. We assume no liability for any loss arising from any investment made based on the information provided in this communication. This communication must not be reproduced or further distributed without our prior written permission.


