Bank of America Corporation Common Stock (BAC) 2020 first-quarter Earnings Report.
The Bank of America Corporation is expected to report its earnings on Wednesday, April 15, before the US markets open. While earning reports start with banks, which are at the center of any operation of the inhibitor of economic recession, the first quarter of 2020 broke all banking records – let’s have a short overview of what the FED has done till now in 2020:
“March 2nd, the FED reduced interest rates by 100 basis points to 0.25%1.25%. During this time, the FED also pumped a $2.3 trillion package of measures on top of the trillions already in place into the financial system to protect the market and control the USD rate, which was growing following the lower cash in the market. In addition, a massive QE program was launched by the FED with no expiry date, to last as long as the market requires.”
All the above mentioned actions, especially interest rates, will affect the banking system and its income. It is hard to say that in the current situation the banking system is not suffering from the wake of global lockdown, especially when we are talking about the banking system in the country which has the biggest number of effected and death, according to WHO data to date (14 April).
Because of the lockdowns around the world, factories and industries have been closed, banking transactions are reduced and consumers are spending less. This, along with the low interest rates, are all affecting the banking system directly into weaker growth prospects.
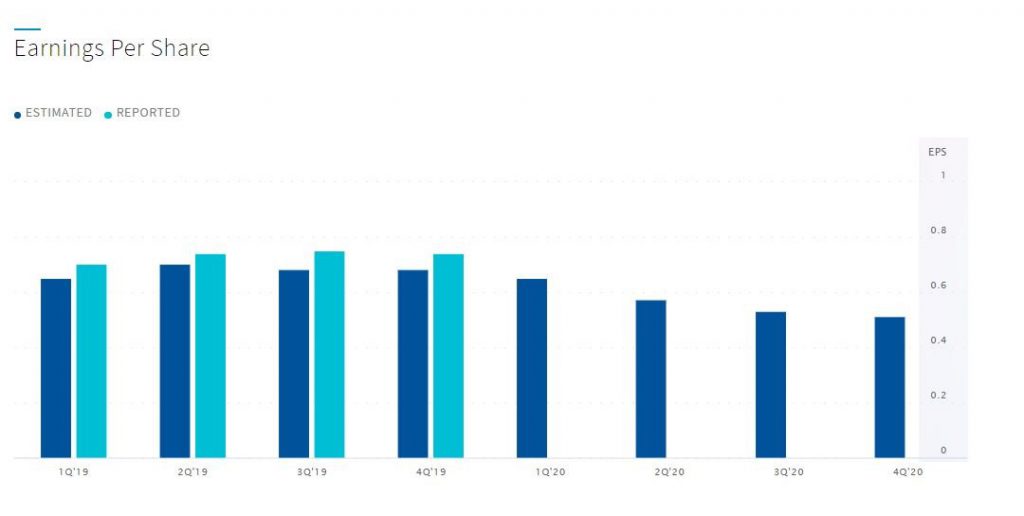
For Q1 2020, the market and analysts expect lower earnings and revenue for BOA, compared to the same quarter of a year ago. Tomorrow’s report will give us a sign of the initial damage from the pandemic, which caused the lockdown and its effects, mostly in the last month of the reporting period. However, while for the second quarter investors are expecting the worst, according to Zacks Investment Research, based on 8 analysts’ forecasts, the consensus EPS forecast for the quarter is $0.65. The reported EPS for the same quarter last year was $0.7.
In the below figure, you can clearly see that in all 4 quarters of last year, BOA reported numbers that were way better than markets expected (Source: NASDAQ).
One of the key numbers which we have to look closely, in the report, is the “Net Interest Margin”. While the bank by growing the loans in the last quarter, the current situation will decline the net interest income, at least for the first six months of 2020. This index shows the The difference between net interest income a financial firm generates from credit products (loans ,mortgages etc) with the outgoing interest it pays to the holders of savings accounts. This index is significant because it will show whether the bank operates profitably, or not.
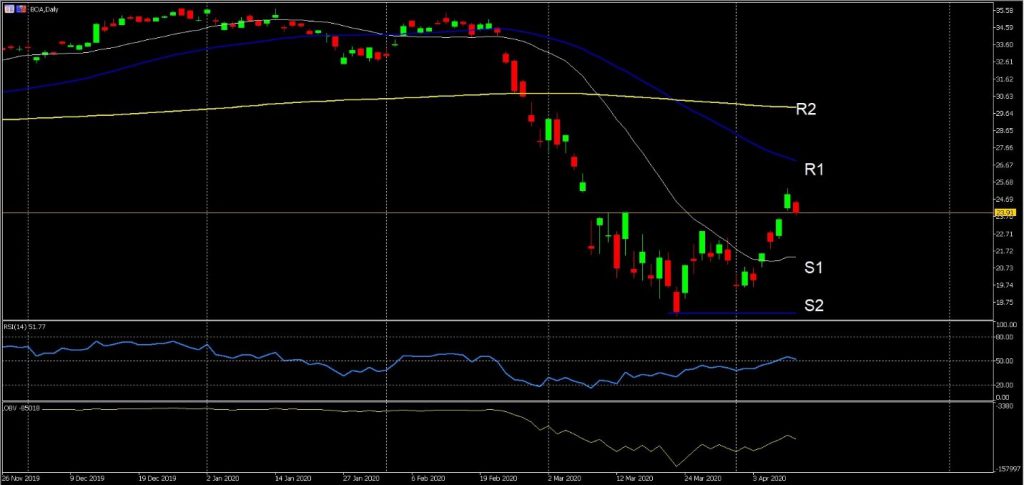
BOA technical overview – Daily Chart
RSI just moved above 50, after sharp decline of February and March to 27 months low at $18, from its historical high of $35.85, seen in January, however, it is still under 200 & 50 DMA and it’s hard to believe it is back to uptrend un the current level, as long as candles cannot breathe above 50 DMA at $27. The next resistance sits at $30 (200 DMA). We can see these levels in case if reports will be better than expected, but above $30 is fare than current images, since the report cannot cover all COVIS-19 caused damages. On the flip side, weaker than expected report will put the $18 (March 23, low) at the radars, while 20 DMA at $21.40 is the first resistance to breach.
Click here to access the HotForex Economic Calendar
Ahura Chalki – Regional Market Analyst
Disclaimer: This material is provided as a general marketing communication for information purposes only and does not constitute an independent investment research. Nothing in this communication contains, or should be considered as containing, an investment advice or an investment recommendation or a solicitation for the purpose of buying or selling of any financial instrument. All information provided is gathered from reputable sources and any information containing an indication of past performance is not a guarantee or reliable indicator of future performance. Users acknowledge that any investment in Leveraged Products is characterized by a certain degree of uncertainty and that any investment of this nature involves a high level of risk for which the users are solely responsible and liable. We assume no liability for any loss arising from any investment made based on the information provided in this communication. This communication must not be reproduced or further distributed without our prior written permission.


