


USDJPY, H1
Another mixed set of US data today, with the Weekly Claims once again falling but just as importantly missing expectations. Durable Goods were a positive beat but the advance goods trade deficit widened and the final reading of Q1 GDP remained unmoved at -5.0%.
US initial jobless claims fell -60,000 to 1,480,000 in the week ended June 20 following the disappointing small -26,000 drop to 1,540,000 (was 1,508,000) in the June 13 week which also coincided with the BLS survey period. This is a 12th straight decline in claims after the record surge to the all-time high of 6,867,000 in the March 27 week. The 4-week moving average continued to slip and was at 1,620,750 versus 1,781,500 (was 1,773,000). Continuing claims dropped -767,000 to 19,522,000 in the week of June 13 after falling -317,000 to 20,289,000 (was 20,544,000).
US durable goods orders bounced 15.8% in May, a little firmer than expected and the biggest leap since July 2014, following the -18.1% (was -17.7%) plunge in April (the second worst on record) and the -16.7% drop in March. Transportation orders climbed 80.7% after April’s -48.6% (was -47.3%) plunge. Excluding transportation, orders rebounded 4.0% from -8.2% (was -7.7%) previously. Nondefense capital goods orders excluding aircraft climbed 2.3% from -6.5% (was -6.1%). Shipments were up 4.4% in May from -18.6% (was -18.2%). Nondefense capital goods shipments excluding aircraft rose 1.8% from -6.2% (was -5.7%). Inventories edged up 0.1% versus the prior unchanged reading (was 0.2%).
US Q1 GDP was unrevised at -5.0% in the third look at the data, and compares to -4.8% in the Advance number, and 2.1% in Q4 2019. Personal consumption was down -6.8%, as it was in the second report, and was -7.6% in the Advance, and 1.8% in Q4. Fixed investment was revised up to a -1.3% pace from -2.4% in the second look, and was -0.6% in Q4. Government consumption was bumped up to 1.1% from 0.8% previously and 2.5% in Q4. Inventories subtracted -1.56%, revised down from -0.98%, while net exports added 1.3%, also lowered from 1.5% previously. The GDP chain price index posted a 1.4% rate, as it did in the second look, and was 1.3% in Q4. The core rate rose to 1.7% from 1.6% previously and 1.3% in Q4.
Finally, the US advance goods trade deficit widened to -$74.3 bln in May from -$70.7 bln (was -$69.7 bln). Exports fell -5.8% to $90.1 bln after plunging -25.1% to $95.6 bln in April. Imports dropped -1.2% to $164.4 bln following the -13.6% decline to $166.3 bln previously. Wholesale inventories declined -1.2% to $642.2 from $649.9 bln (was $651.5 bln), with retail inventories dropping -6.1% to $604.5 bln from $643.8 bln (was $644.9 bln).
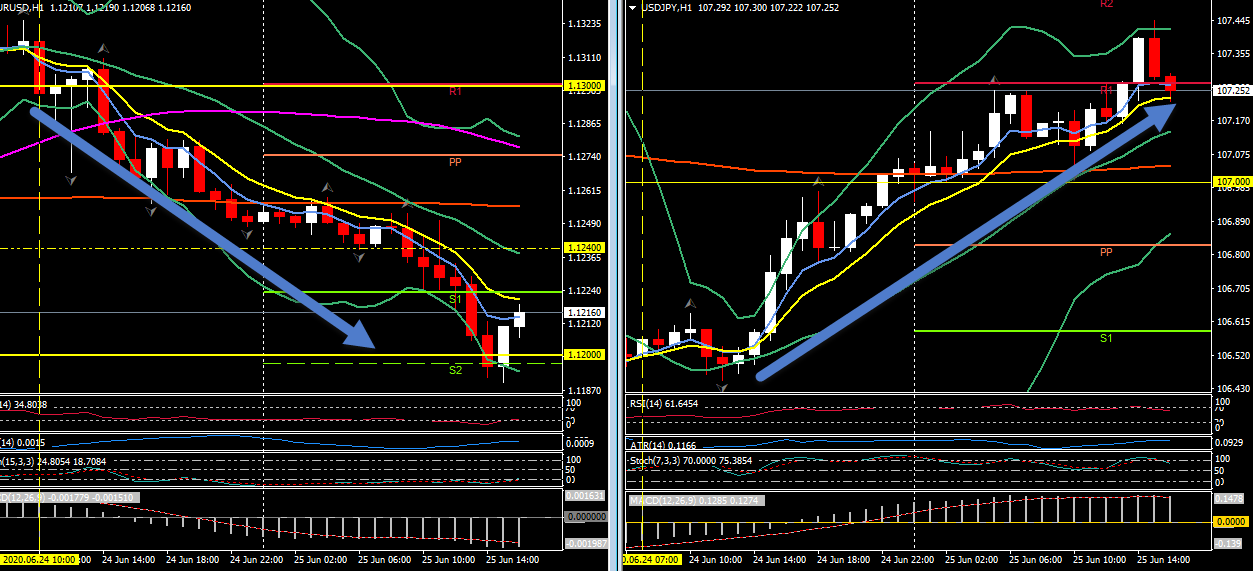
All of this has taken the shine off the USD recovery today – USDJPY slipped from 107.45 back under R1 at 107.20 and EURUSD moved up from S2 sub-1.1200, to 1.1225. However, both remain on trend from key moves which were initiated yesterday.
Click here to access the HotForex Economic Calendar
Stuart Cowell
Head Market Analyst
Disclaimer: This material is provided as a general marketing communication for information purposes only and does not constitute an independent investment research. Nothing in this communication contains, or should be considered as containing, an investment advice or an investment recommendation or a solicitation for the purpose of buying or selling of any financial instrument. All information provided is gathered from reputable sources and any information containing an indication of past performance is not a guarantee or reliable indicator of future performance. Users acknowledge that any investment in Leveraged Products is characterized by a certain degree of uncertainty and that any investment of this nature involves a high level of risk for which the users are solely responsible and liable. We assume no liability for any loss arising from any investment made based on the information provided in this communication. This communication must not be reproduced or further distributed without our prior written permission.


