


After the release of dismal commercial delivery figures, The Boeing Company [NYSE:BA] is scheduled to announce its Q3 result on 28th October, at 14:30 am (GMT).
。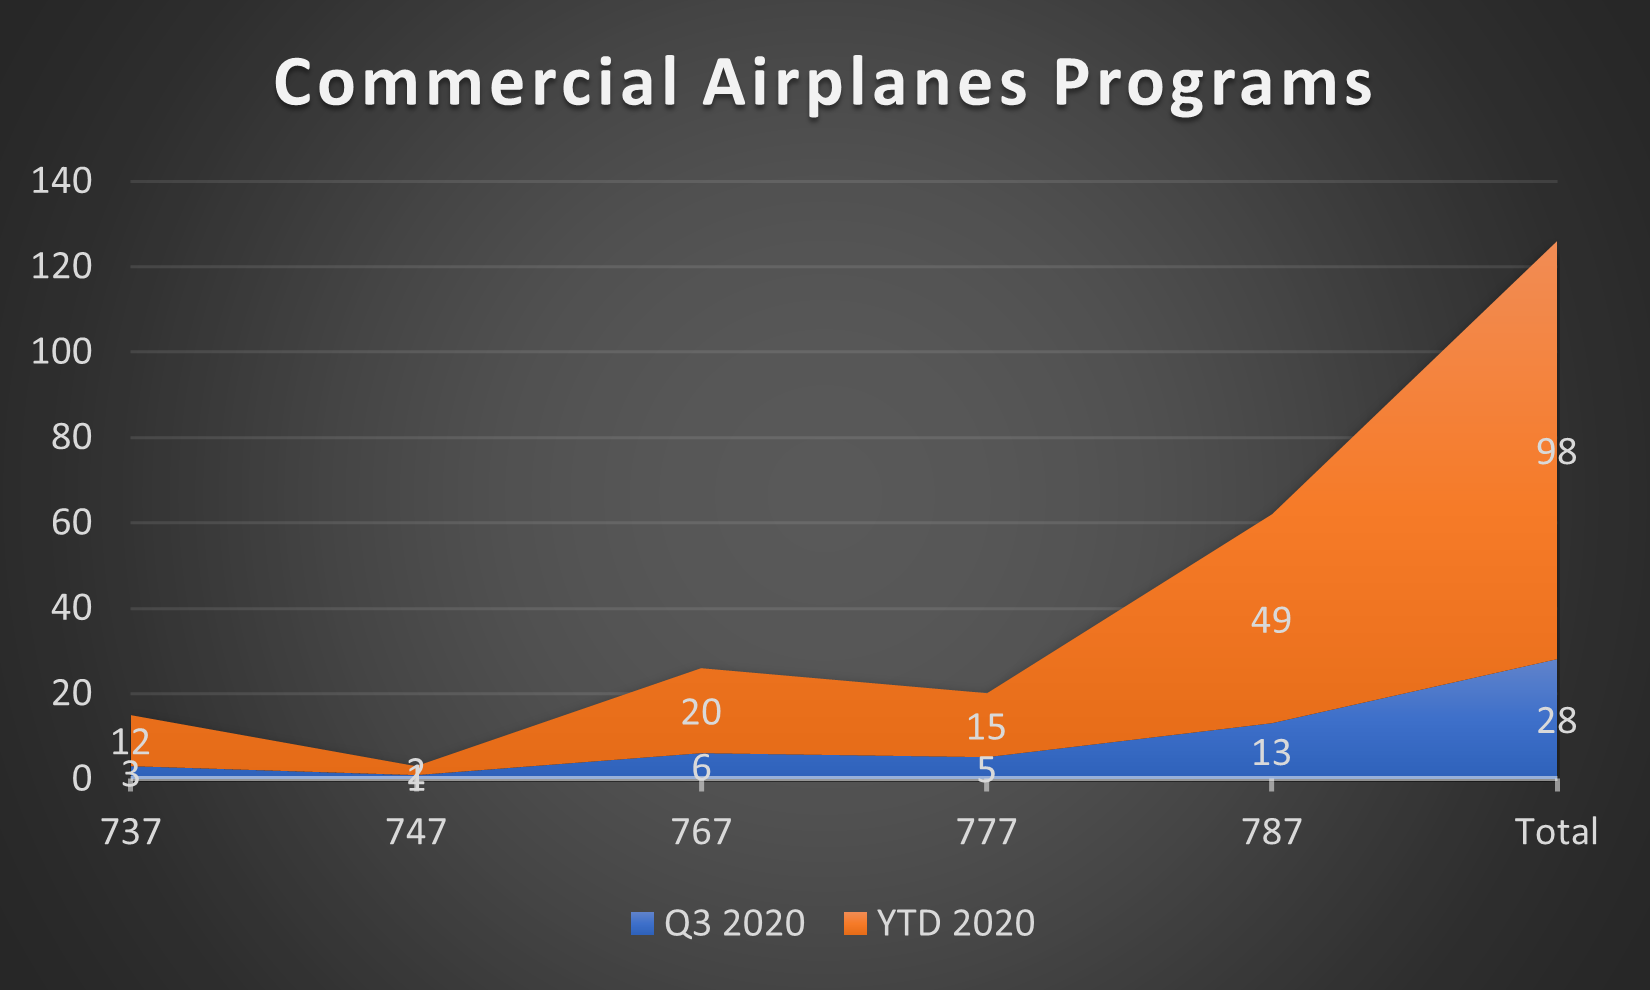
Graph 1: Commercial Airplanes Programs in Q3 versus 2020 YTD
Based on the company’s press release that was released on 13th October, we have plotted a graph as seen above which displays BA’s program deliveries across its commercial operations during the third quarter and year-to-date 2020. In general, it is noticed that the total number of programs delivered in Q3 equals to only 28 while the YTD figure stands at 98.
Overall, Boeing’s Q3 deliveries in commercial shipments has plunged massively by 108.1% (Y-o-Y). Such a massive plunge in deliveries was likely driven by a number of factors apart from the impact of the coronavirus pandemic, such as the strict travel bans being imposed globally which have greatly hampered market demand. In particular, demand for Boeing’s 737 jets has remained at a low level since the two deadly crashes last year. In addition, manufacturing flaws in the 787 model as reported last month has crippled the delivery flow of this product line. Deteriorating market demand and poor delivery figures will lead to an increase in the company’s expenses for storage, while frequent cleaning of facilities, adjusted schedules and work flows by abiding with social distancing rules may increase operating costs as well, thus negatively affecting the company’s revenue.
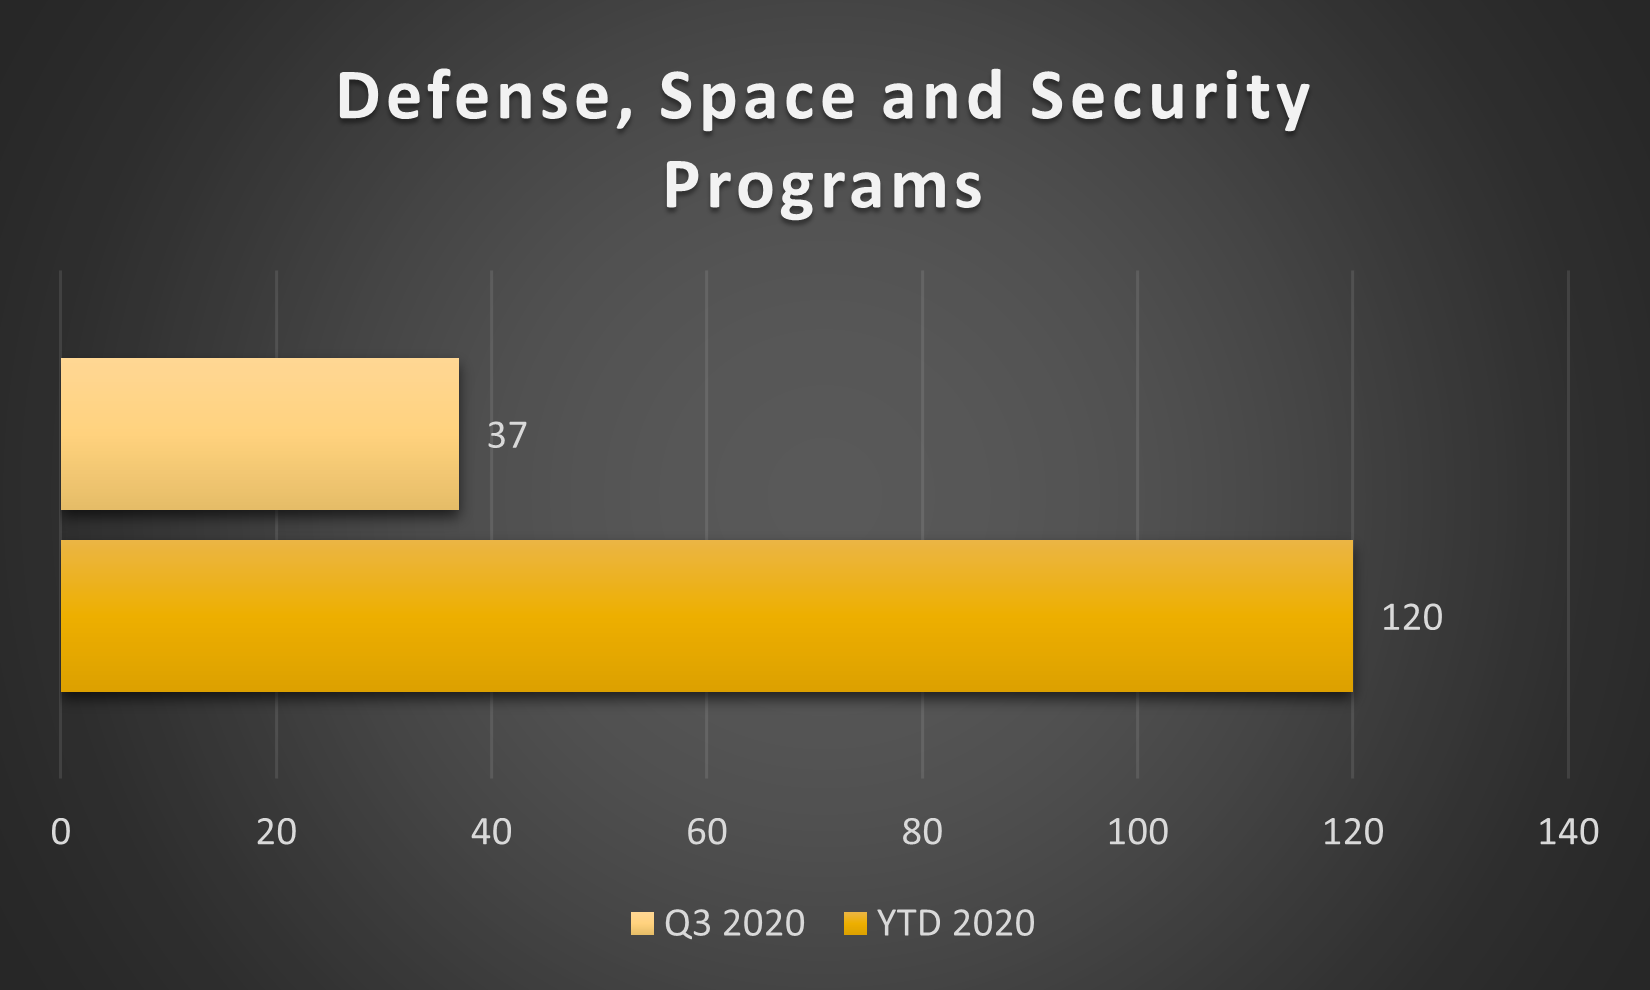
Graph 2: Defense, Space and Security Programs in Q3 versus YTD 2020
In its Defense, Space and Security Programs, Boeing’s defense deliveries have reduced by over 50% (Y-o-Y) to 37 in Q3 2020, while the YTD figure stands at 120. Needless to say, shipment activities within the US as well as across borders have been affected on a large scale following coronavirus-led restrictions.
Since the outbreak of the virus pandemic, the Aerospace-Defense industry has been ranked mercilessly by Zacks in the bottom 10%. A prediction has been made that Boeing will post a quarterly loss of $2.23 per share in its Q3 financial report, which represents a change of -253.8% (Y-o-Y). Sales revenues are also expected to reach $13.81 billion, down 30.87% from the year-ago quarter. Therefore, the overall outlook for the company remains bleak. It is ranked #4 in Zack’s system, indicating to SELL.
Nevertheless, the consensus rating by 30 Wall Street analysts remains cautiously positive with only 6 sell ratings, versus 15 hold ratings and 9 buy ratings. The average twelve-month price target for BA’s share price is set at $209.07. Ceiling price may hit $360.00 while floor price may be as low as $110.00, according to these analysts.
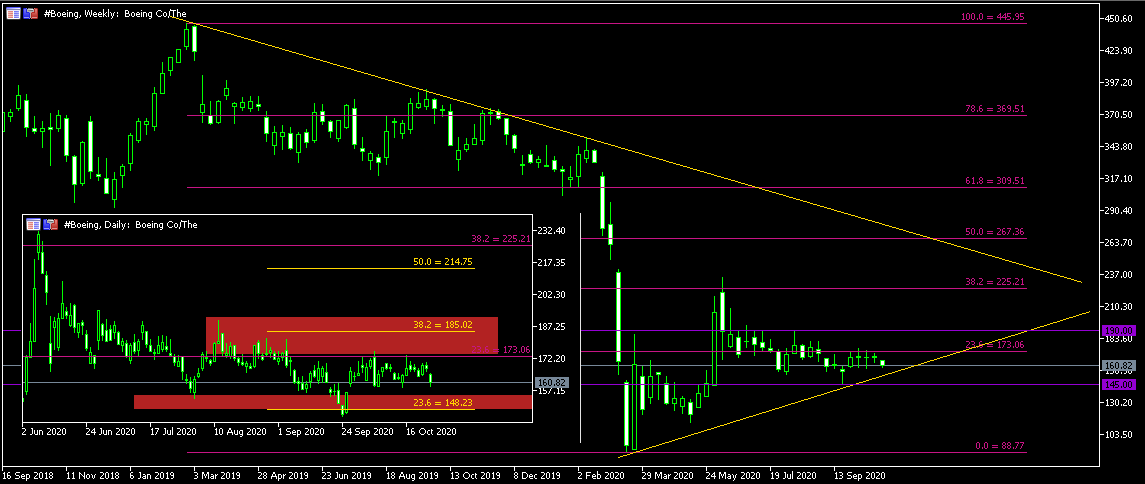
From a technical point of view, the Weekly chart shows that the #Boeing share price remains trapped within a symmetrical triangle, which indicates that price momentum will likely remain at a relatively low level until a solid breakout occurs. As of yesterday, it last closed at $160.82. The nearest resistance sits at $175.00 which corresponds to the Weekly 23.6 Fibonacci Retracement level, followed by $185.00 – $190.00, or the Daily 38.2 Fibonacci level. A successful breakout above these two important zones may suggest the company’s share price will extend higher into $225.00. On the other hand, the ascending trendline of the symmetrical triangle acts as an immediate support to the asset price. Moving further, the next support can be found around $145.00 – $150.00.
Click here to view the economic calendar
Larince Zhang
Market analyst
Risk disclaimer: The content of this website is for general marketing communication purposes only, for reference only and does not constitute independent investment research. Any content on this website does not contain or should not be regarded as investment advice for buying and selling any financial instruments. The information provided on this website comes from reputable financial resources, and any information containing past performance indicators in the content cannot or reliably indicate future performance. All users should understand that any investment related to leveraged products has a certain degree of uncertainty. Investments of this nature involve high risks and all users should bear full responsibility for this. We are not responsible for any losses caused by any investment made by users in the information provided on this website. Without our prior written permission, no content on this website may be reprinted or copied without permission.


