


United Health Group (NYSE: UNH) is scheduled to release its Q4 2020 earnings results this Wednesday (20th January) before market open. It is the largest health care services company in the world and is ranked among the top in the Insurance and Managed Care sector, serving a broad base of individuals globally by providing health care coverage and benefits services (UnitedHealthcare) and providing information and technology-enabled health services (Optum).
The company saw continuous financial growth during the third quarter of 2020 due to its ability to deliver innovative solutions to support care providers, patients, customers and communities in the midst of the Covid-19 pandemic. Its revenue in Q3 reported an increase of 7.78% (or $4.7 billion) (Y-o-Y) to $65.1 billion. Net earnings and adjusted earnings were reported at $3.30/share and $3.51/share, respectively. Despite the temporary impact of care deferrals earlier in the year, the underlying business performance of the company remains solid as it resumed its expansive response efforts in delivering more innovative solutions for consumers, customers and care providers as well as communities and people affected by the pandemic. All in all, the company is expecting to achieve an adjusted EPS of $16.50 – $16.75 for the full year.
According to the Zacks Consensus Estimate, UNH is expected to report an increase of 7.12% (Y-o-Y) in revenue to $65.24 billion. Nevertheless, an estimation is also made that the company shall post a decline in EPS by 38.72% (Y-o-Y), to $2.39/share.
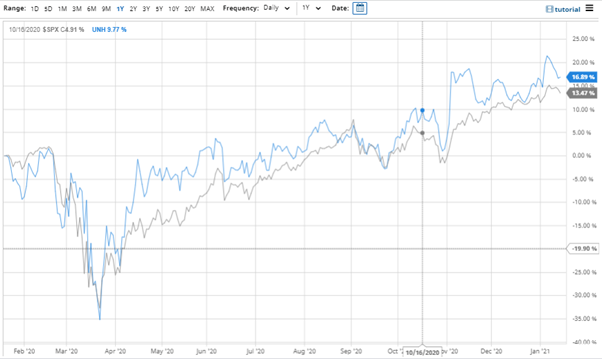 Chart 1: Correlation between % changes in S&P 500 Index and UNH. Source: https://www.barchart.com/stocks/quotes/$SPX/interactive-chart
As displayed in the chart above, the UNH share price has mostly been performing well above S&P 500 index since the company had its earnings call for Q1 2020 ending 31st March. At the time of writing, shares of the largest US health insurer had gained 16.89%, outpacing the S&P 500’s gain of 13.47% in that time. The graphical relationship between the two data may suggest a sign of optimism about the company’s business outlook. In general, the company is ranked by Zacks at #3, which means to Hold.
On the other hand, the consensus price target issued by 21 Wall Street analysts indicates a possible upside of over 9% towards an average 12-month price target at $385.32. Ceiling price and floor price for the shares have been set at $454.00 and $330.00, respectively. Out of the 21 analysts involved, less than 24% (5) have given ‘hold’ ratings, while a majority have given ‘buy’ ratings which represent about 71% of the group.
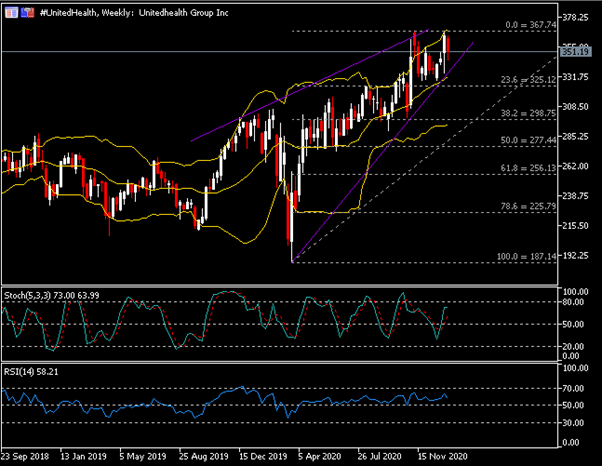 Technically speaking, the #UnitedHealth share price has been on a healthy bullish run for nearly 3.7 decades since it went public back in in 1984. As displayed in the Weekly chart above, the company’s share price has recouped its cyclical losses experienced during mid-March 2020, in line with the global stock market crash following investors’ fear towards the coronavirus outbreak. Its share price reached an all-time high at $367.23 in November, up +96.23% from the lows seen in March.
Currently, the share price remains traded below the upper Bollinger band, within an ascending wedge. Stochastics and RSI remain well above 50.
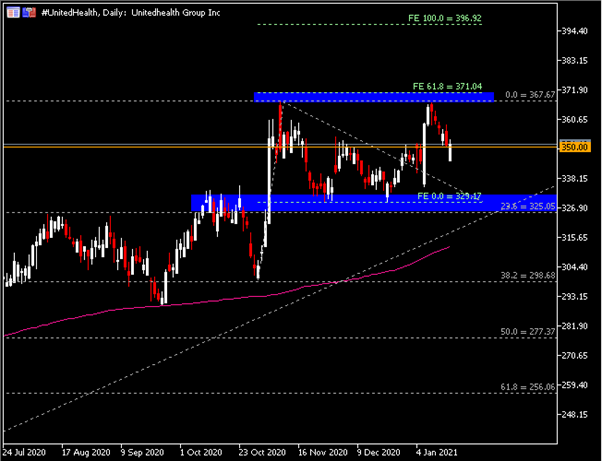
On the contrary, the Daily chart has shown that #UnitedHealth is currently testing the key level $350.00. If an attempt to break above the level is successful, $367.50 – $371.00 (which also corresponds to upper BB as displayed in the Weekly chart) shall serve as another important resistance zone in the near term. Otherwise, if the share price fails to break above $350.00, the support zone to focus on in the short-term will be $325.00 – $330.00, 200-SMA (pink) and 38.2 Fibonacci Retracement level ($300.00).
Click here to access the HotForex Economic Calendar
Larince Zhang
Market Analyst
Disclaimer: This material is provided as a general marketing communication for information purposes only and does not constitute an independent investment research. Nothing in this communication contains, or should be considered as containing, an investment advice or an investment recommendation or a solicitation for the purpose of buying or selling of any financial instrument. All information provided is gathered from reputable sources and any information containing an indication of past performance is not a guarantee or reliable indicator of future performance. Users acknowledge that any investment in Leveraged Products is characterized by a certain degree of uncertainty and that any investment of this nature involves a high level of risk for which the users are solely responsible and liable. We assume no liability for any loss arising from any investment made based on the information provided in this communication. This communication must not be reproduced or further distributed without our prior written permission.


