US ADP reported private payrolls increased 117k in February, well below forecast (177k), though the 174k January gain was revised higher to 195k. The service sector supported the increase, with jobs rising 131k. In this sector, trade/transport led with a 48k increase, followed by education/health with a 35k gain, while leisure/hospitality added 26k. Employment in the goods sector declined -17k including a -14k drop in manufacturing and a -3k dip in construction. As for company size, small firms added 32k workers, with medium sized companies adding 57k, with a 28k increase for large firms.
The US Dollar slipped following the February ADP jobs report but quickly recovered, turning the USDIndex close to 91.00. Firmer Treasury yields should keep USD bulls in control, while struggling equities may keep the Greenback’s safe-haven status in effect. The USA500 and the USA100 have slipped into negative territory. Bonds are for sale globally, led by Treasuries and Gilts. Reflation trades and the advent of a boatload more of stimulus are weighing, with a double whammy of reluctant investors afraid to step in after very poorly received auctions of late. The 10-year yield has cheapened 7.2 bps to 1.46%, with the bond 6 bps higher to 2.25%, while the Gilt has climbed 8 bps to 0.764%.
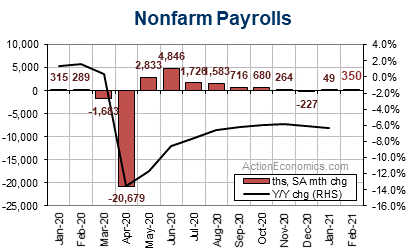
Looking ahead, today’s data signal only modest downside risk for payrolls on Friday, given the loose correlation of the “as reported” figures to monthly payroll swings. The estimates in the market have major divergence, with the Reuters Poll estimating 180K, FXstreet at 195Kn while Action economics estimates a 350k February nonfarm payroll bounce that lies above market forecasts, as big January divergences in the jobs data are partly reversed. The range in the Reuters Poll estimates varies from -100,000 to 500,000, which is massive.
In the meantime, in January, a huge 0.9% hours-worked gain was composed of a lean 49k payroll rise but a 35.0 workweek that marked a 21-year high. Hence a payroll bounce should be seen in February with a workweek pullback to 34.9, alongside a flat hours-worked figure. The jobless rate is expected to hold at 6.3%, while hourly earnings rise 0.1%. The February establishment survey was for a reference week before the Texas freeze, but we will likely see distortions in the household survey.
Seasonal Trends and Weather
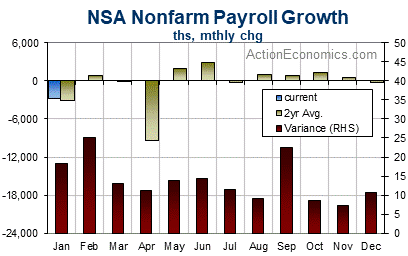
The graph below shows the two-year average NSA payroll change for each month. The seasonal impact through the year on payroll changes is mostly positive, but is negative in December, January and July. Distortions of last year’s COVID-19 hit have produced negative averages for March and April now as well. The NSA average rebounded to 859k in February from -3,026k in January, and -288k in December. The red bars show each month’s variance. After a first-half peak in February, variance decreased over the spring before reaching a second-half peak in September.
For disruptions to employment from weather as gauged in the household survey, the biggest disruptions occur in the winter months generally, with the average peaking in February. There is an additional climb through the late-summer months due to disruptive hurricanes in some years. The ten-year average number of people not working as a result of weather climbed to 363k in February from 336k in January, 160k in December, and 107k in November. The extreme cold across the south began mostly after the BLS survey week, but the distortions will likely be captured in the household survey, leaving a potential big hit to this household series.
The Birth/Death Assumption
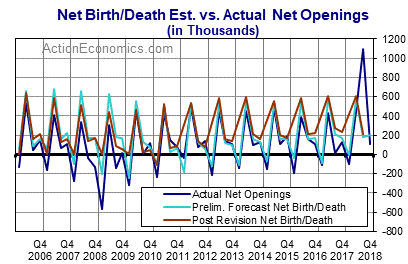
The average net birth/death effect rebounded to 117k in February, up from -306k in January, -9k in December, and -10k in November. Its annual high typically occurs in April and its annual low in January. After the January low, the month of July marks a summer trough for the average which becomes more volatile in the second half of the year, oscillating between negative and positive territory with a second-half trough in September and a peak in October.
The BLS birth/death assumptions are adjusted each quarter with data from the Quarterly Census of Employment and Wages (QCEW). The QCEW data has been released through 1Q21, and shows a net birth/death effect that was Weaker than assumed in the original monthly report. The QCEW data show a -160k net birth effect for 1Q21, compared to the 24k initial assumption.
Hourly Earnings
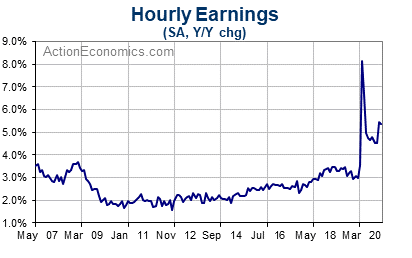
We expect a 0.1% rise for February average hourly earnings, after gains of 0.2% in January, 1.0% in December and 0.3% in November, with swings that likely still largely reflect the percentage of lower paid workers in the jobs pool, as seen with the 4.7% surge last April and the 1.0% pop in December. We expect a 5.2% y/y increase in February, which is down from 5.4% in January. Growth in hourly earnings was gradually climbing from the 2% trough area between 2010 and 2014 to the 3%+ area until the economy’s plunge last March. The y/y wage gains will be distorted through 2021 via the comparison effects from last year’s wage spike and ensuing unwind.
The ECI data are designed to avoid distortion from the shift in the composition of jobs that sharply impacted the payroll report’s wage measure. The ECI revealed a 0.7% Q/Q rise in Q4, with a 2.5% y/y gain that exceeded the 2.4% in Q3, versus a 1.4% cycle-low in Q4 of 2009. We saw a 2.6% y/y increase for wages and salaries in Q4 after 2.5% in Q3, versus a 1.4% cycle-low in Q4 of 2011. We saw y/y benefit cost growth of 2.3% in Q4, as seen in Q3, versus a 1.5% cycle-low in Q3 and Q4 of 2009.
Continuing and Initial Claims
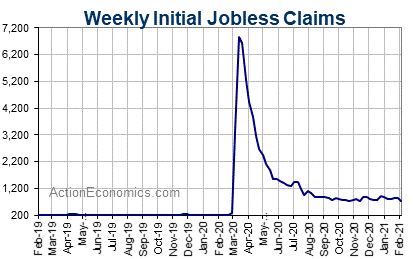
Continuing claims fell -366k between the January and February BLS survey weeks after a -551k drop between December and January, and a -767k drop between November and December. Despite setbacks around renewed lockdowns at year end, the economy continues to unwind the 24,912k continuing claims peak in the second week of May. Initial claims fell to 841k in the February BLS survey week from prior BLS survey week readings of 875k in January and 892k in December. We expect a February initial claims average of 785k from 852k in January and 825k in December. We saw a 49-year low for weekly claims of 193k in April of 2019.
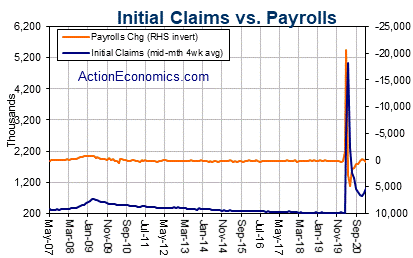
The four-week average for initial claims has a strong inverse relationship with the monthly payroll gain. Until the massive claims surge caused by COVID-19, claims had been surprisingly tight relative to the rate of job growth, presumably due to reduced job churn in the latter half of this expansion. This relationship has taken a wild ride since COVID-19, and initial claims won’t be particularly useful for forecasting payrolls until we see how the series match up in the post-pandemic environment.
Click here to access the our Economic Calendar
Andria Pichidi
Market Analyst
Disclaimer: This material is provided as a general marketing communication for information purposes only and does not constitute an independent investment research. Nothing in this communication contains, or should be considered as containing, an investment advice or an investment recommendation or a solicitation for the purpose of buying or selling of any financial instrument. All information provided is gathered from reputable sources and any information containing an indication of past performance is not a guarantee or reliable indicator of future performance. Users acknowledge that any investment in Leveraged Products is characterized by a certain degree of uncertainty and that any investment of this nature involves a high level of risk for which the users are solely responsible and liable. We assume no liability for any loss arising from any investment made based on the information provided in this communication. This communication must not be reproduced or further distributed without our prior written permission.


