


Honeywell and American Express are among the largest American companies in the field of complex electronic technologies and financial services, and their shares are among the largest movers in the primary market, so today we will review the most important aspects of these companies ahead of their earnings releases, in addition to a comprehensive technical analysis for both entities. Both stocks are anticipated to appreciate after the earnings releases tomorrow. But let’s take them one at a time.
Honeywell: On its previous earnings report for Q4 2020, on Friday January 29, 2021, Honeywell announced a 13% drop in its quarterly profits as the coronavirus crisis hurt sales in its core aviation business, which manufactures parts for Boeing BA.N aircraft and Airbus AIR.PA. However, the company expects a pickup in 2021 sales and is likely to benefit from shipments of the Boeing 737 Max, which was allowed to start flying again after a 20-month ban.
Boeing will mainly ship the 737 Max jets this year from its stockpile of about 450 aircraft, while slowly ramping up production of the aircraft as air travel begins again alongside the launch of coronavirus vaccines. Honeywell’s aviation unit is also seeing an improvement in demand for business jet parts, as wealthy travellers look to avoid commercial flights during the COVID-19 pandemic.
The company forecast 2021 sales are around $8.1 billion, which is 4% lower compared to Q1 2020. Honeywell’s net income is expected to come in at $1.27 billion, while earnings per share are expected at $1.80 in the first quarter ended March 31, from $2.21 per share a year earlier.
Honeywell technical analysis:
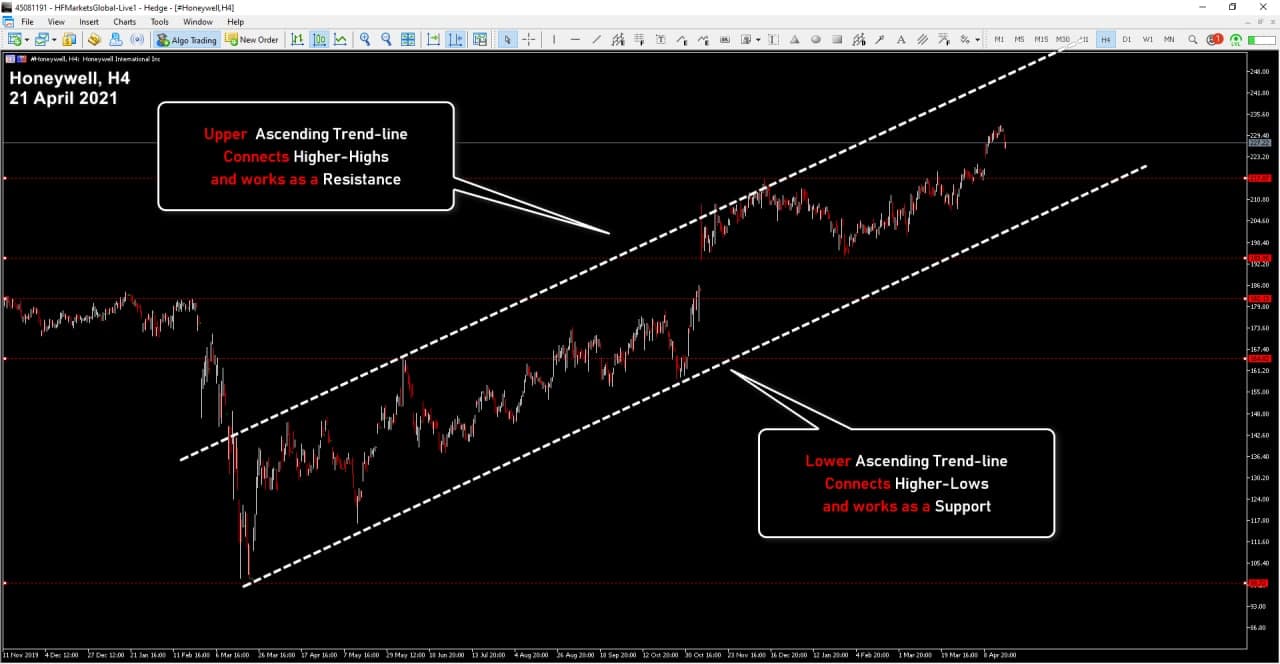
Honeywell is moving in a bullish channel. The upper uptrend line is acting as resistance and connecting higher highs, while the lower uptrend line is acting as support and connecting higher lows, reaching the price at $228. Reviewing the company’s performance during the past year, we find that the lowest low it made was at $101 on March 19, 2020, followed by a high of $165.75 on June 5, 2020, and another low at the same level on November 2, 2020. On December 2020, the price rose in an attempt to breach the resistance line at $216.45 but quickly turned lower at $194.55. Then it bounced back on January 29 of the beginning of this year, so the price succeeded and was able to break through the resistance line, reaching $228.78 on April 13, as shown in the figure below.
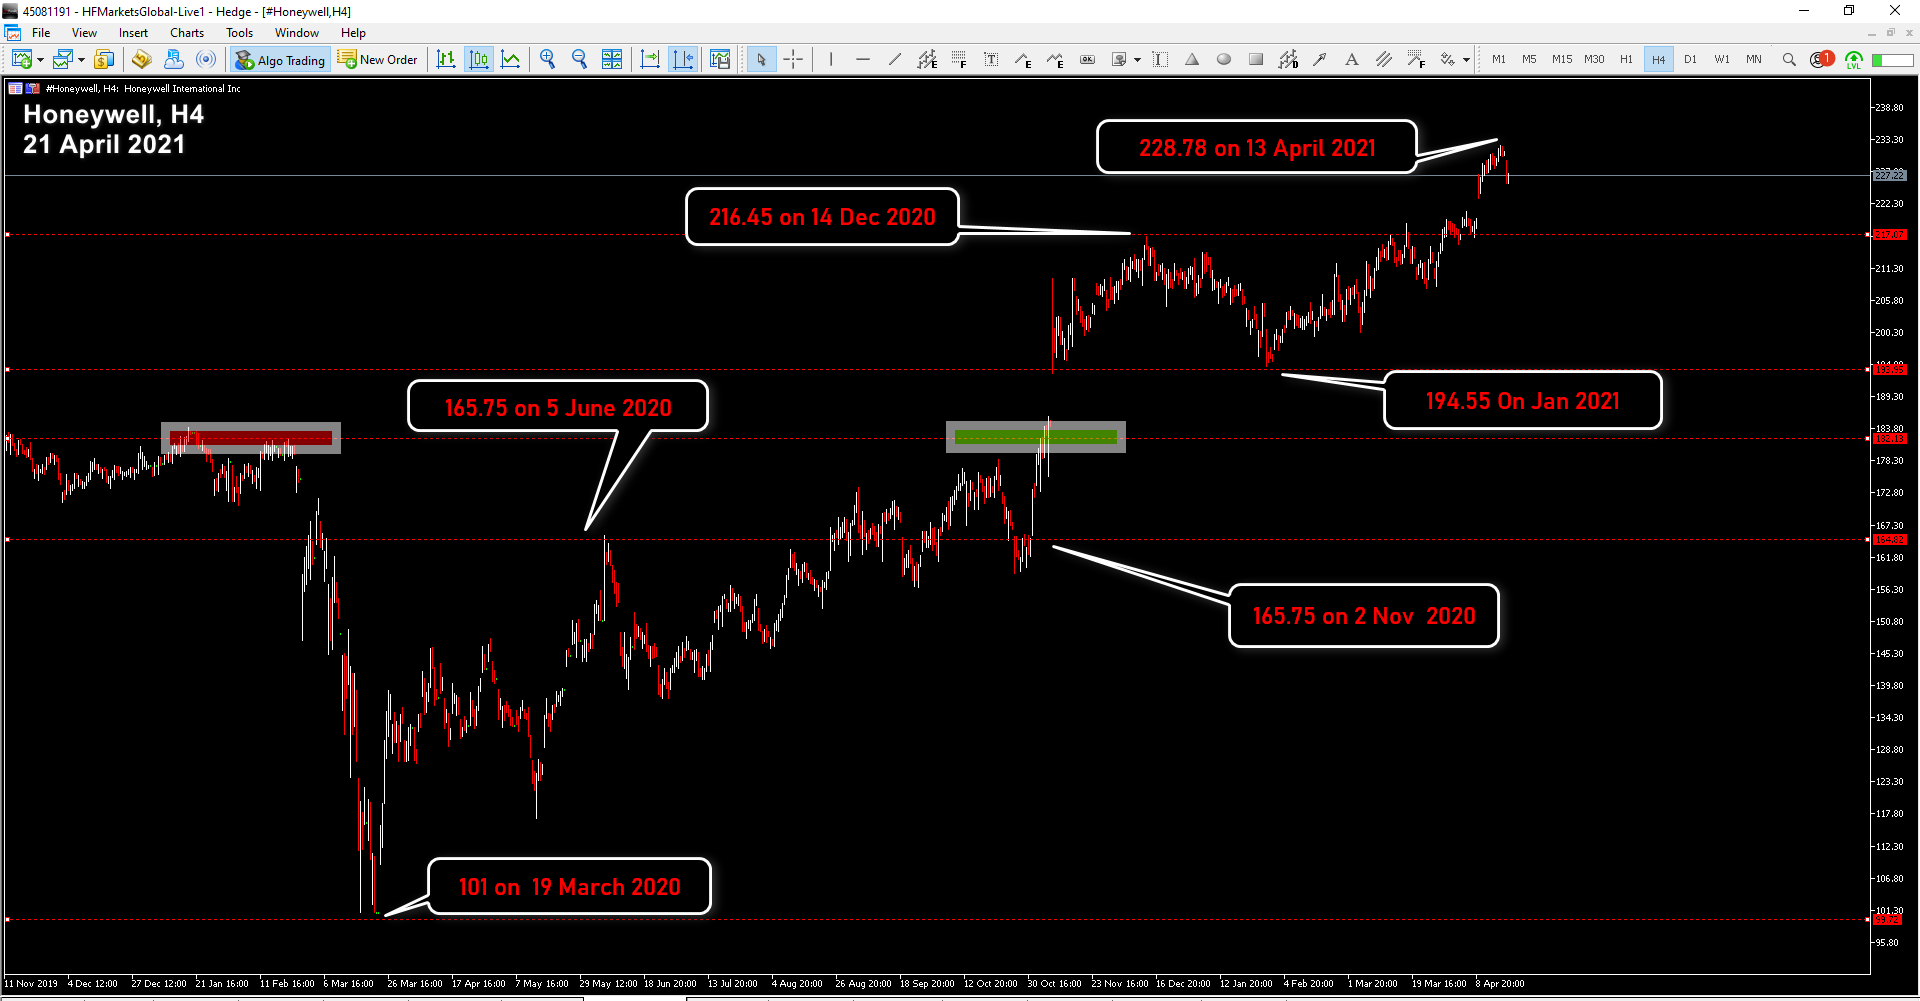
Looking at the above figure, in the hourly timeframe, we find the PP level is located between 225.30 and 226.60, while the R1 is set at 228.78, R2 is at 230.50 and R3 is around 232.10. Looking at the supports, we find S1 above 224, S2 is at 221.40 and S3 at 220.10.
American Express: On Tuesday, January 26, 2021, American Express reported better-than-expected quarterly earnings as higher online eased the damage of the decline for travel and entertainment during the Covid-19 pandemic.
Net income fell to $1.44 billion, or $1.76 per share, for the fourth quarter ended December 31, from $1.69 billion, or $2.03 per share, a year earlier. Analysts expected a profit of $1.31 per share, according to IBES data from Refinitiv. Total revenue, excluding interest expense, decreased 18% to $9.35 billion. “Cardmember spending continued to recover, and spending on travel and entertainment surpassed pre-COVID levels for the second consecutive quarter,” CEO Stephen Squeri said.
AMEX posted a gain of $111 million on consolidated provisions, compared to a loss of $1.02 billion a year earlier, after the credit card issuer issued reserves of $674 million, buoyed by improved macroeconomic outlook, strong credit performance and lower net write-offs.
American Express (NYSE: AXP) ranked 10th in the 2021 “Fortune 100 Best for Work For” list in the United States, marking the second year in a row the company was among the top 10 companies. This position reflects American Express’s strong focus on supporting colleagues, providing learning and growth opportunities, and having a unique and purposeful career journey. The ranking, based in large part on feedback from employees, underlines a firm commitment to fostering an inclusive and diverse environment in which colleagues feel visible, heard and truly belong.
According to Zacks, American Express has an expected earnings growth rate of 23.6% for the current year. The Zacks Consensus Estimate for current-year earnings has improved 0.6% over the last 7 days. This credit card issuer and global payments company is expected to post quarterly earnings of $1.66 per share in its upcoming report, which represents a year-over-year change of -16.2%. Revenues are expected to be $9.24 billion, down 10.4% from the year-ago quarter.
Technical analysis of AMEX’s performance:
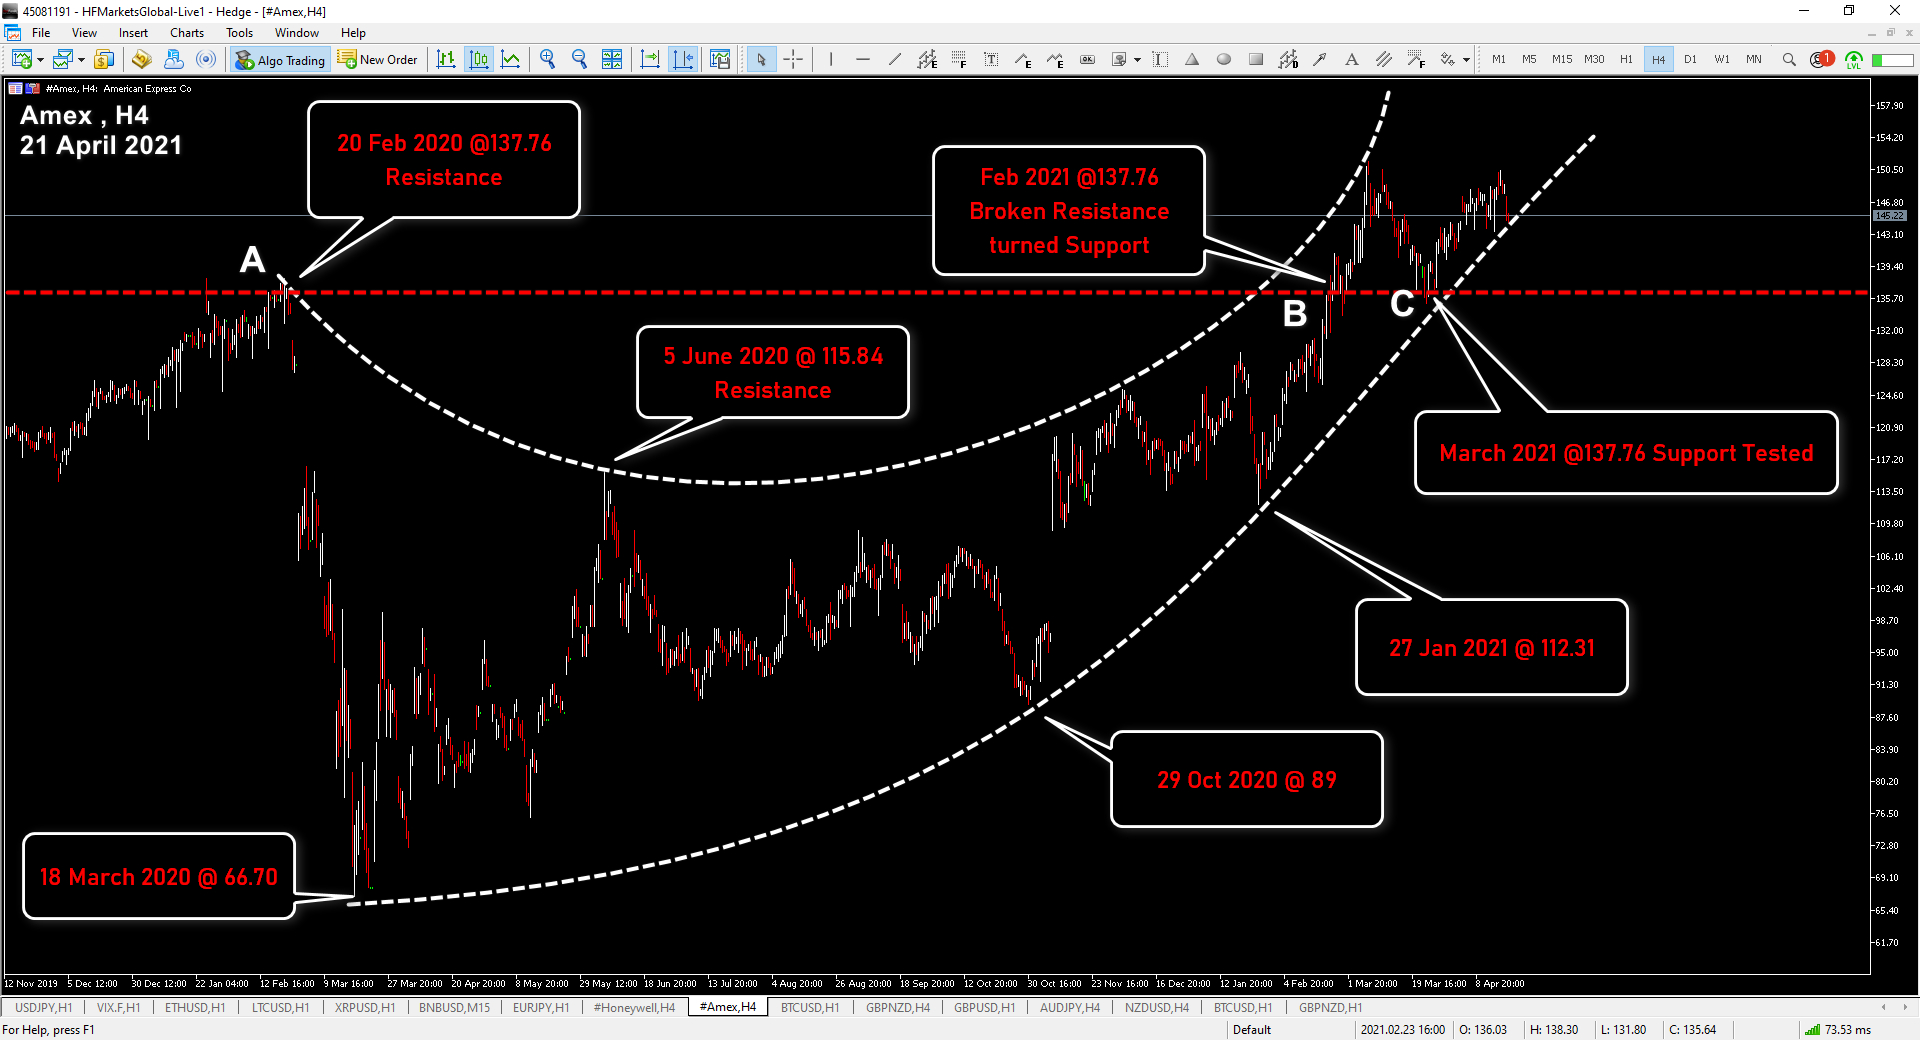
American Express “AMEX” was in a strong upward trend until the pandemic crisis; it reached 137.76 on February 20, 2020, with the main indicators dropping with the outbreak of the pandemic in March, and the share price fell to 66.70 on March 18, 2020. The share price rose to 115.84 on June 5, 2020. It was followed by a correction down to 89.00 on October 29, 2020. In 2021, the asset has gained ground again and managed to break its pre-pandemic high of 137.76 in February 2021 to create a new all-time high at 151.45, which is now the immediate Support for the asset.
RSI reading: The Relative Strength Index (RSI) is a popular momentum indicator used in technical analysis to gauge the strength of a recent price change and represent this reading on a line graph that fluctuates between 0 and 100. The 30 reading on the downside indicates the price has fallen a lot. It is in oversold territory, and is likely to reverse or correct. On the upside, if the indicator reading rises to 70, this indicates overbought value and the price could reverse or a correction occur. Many traders use the Relative Strength Index (RSI) to help make an appropriate decision that one should either continue in or exit from a trade.
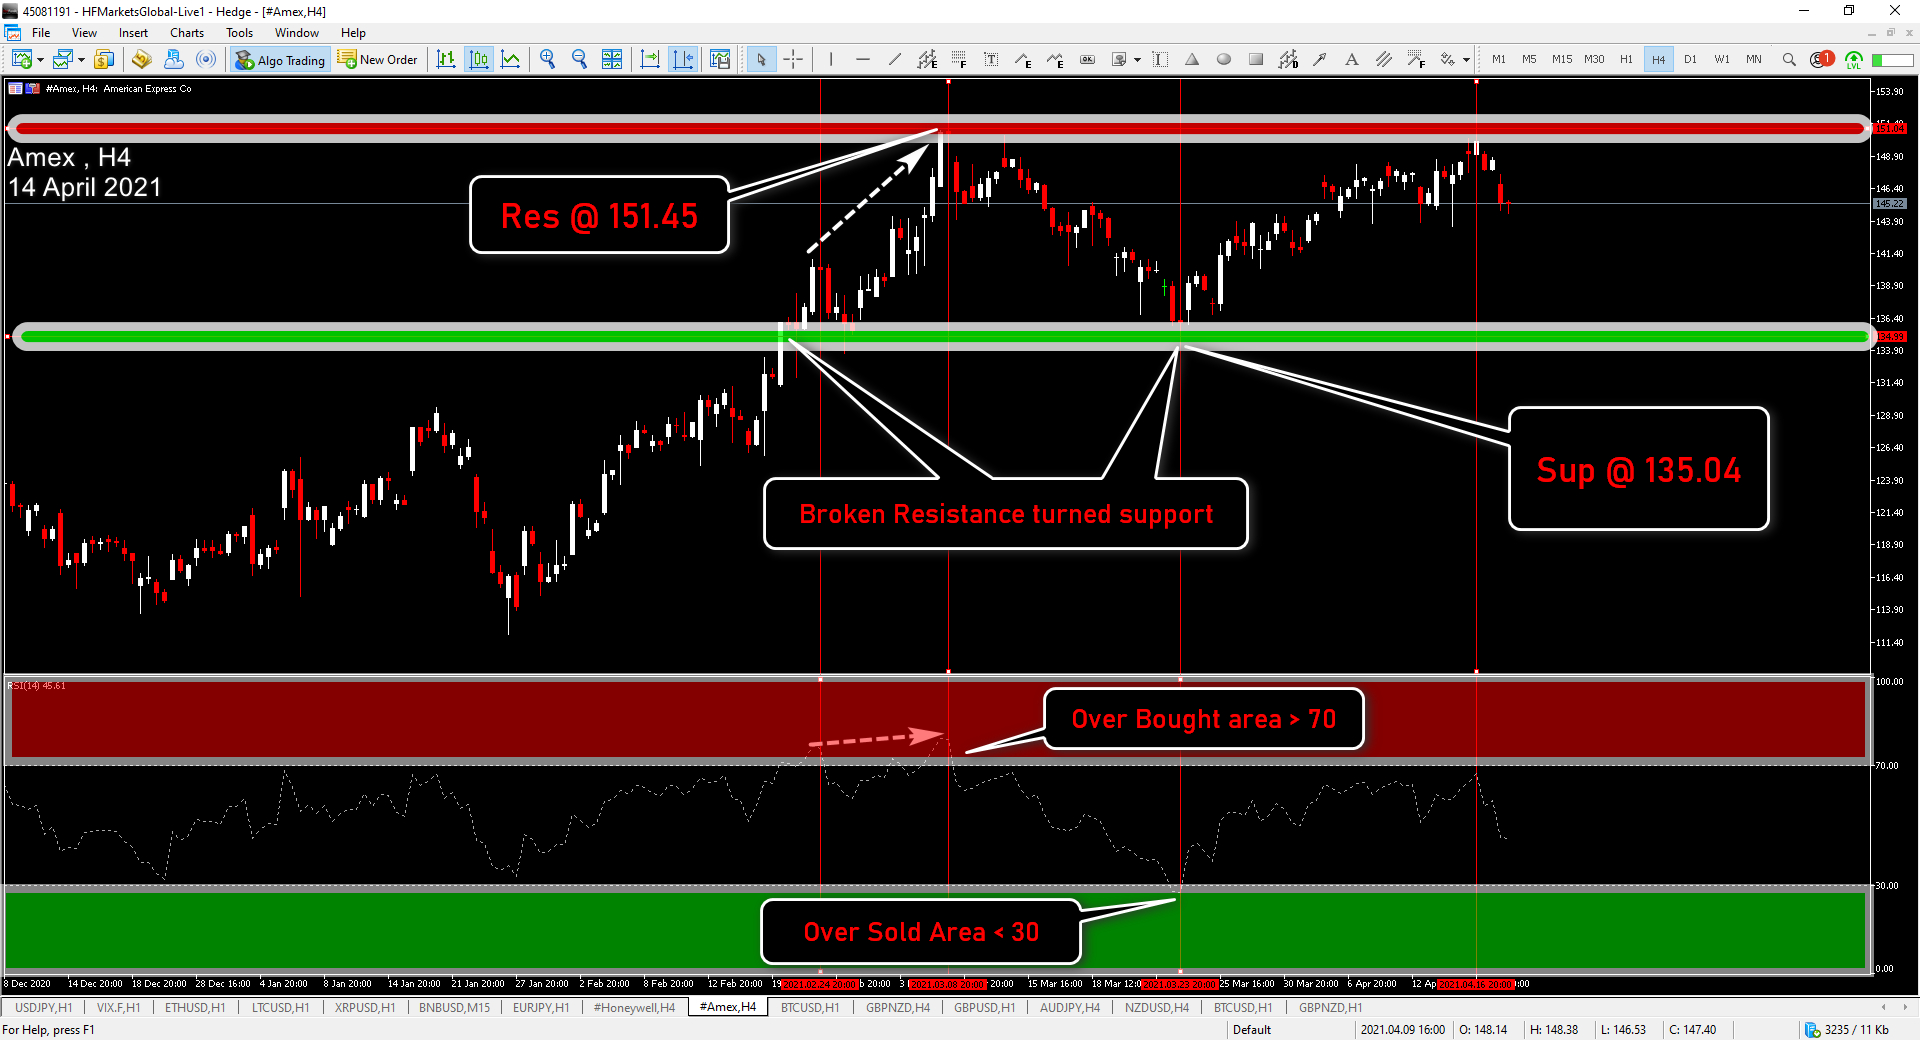
The RSI reading was 70 on March 8, 2021, and fell below 30 on March 23, 2021, before the price reconsidered the overbought area of 70 again on April 5, 2021. The stock is trading between the 135.04 support and 151.04 latest low and highest resistance, respectively.
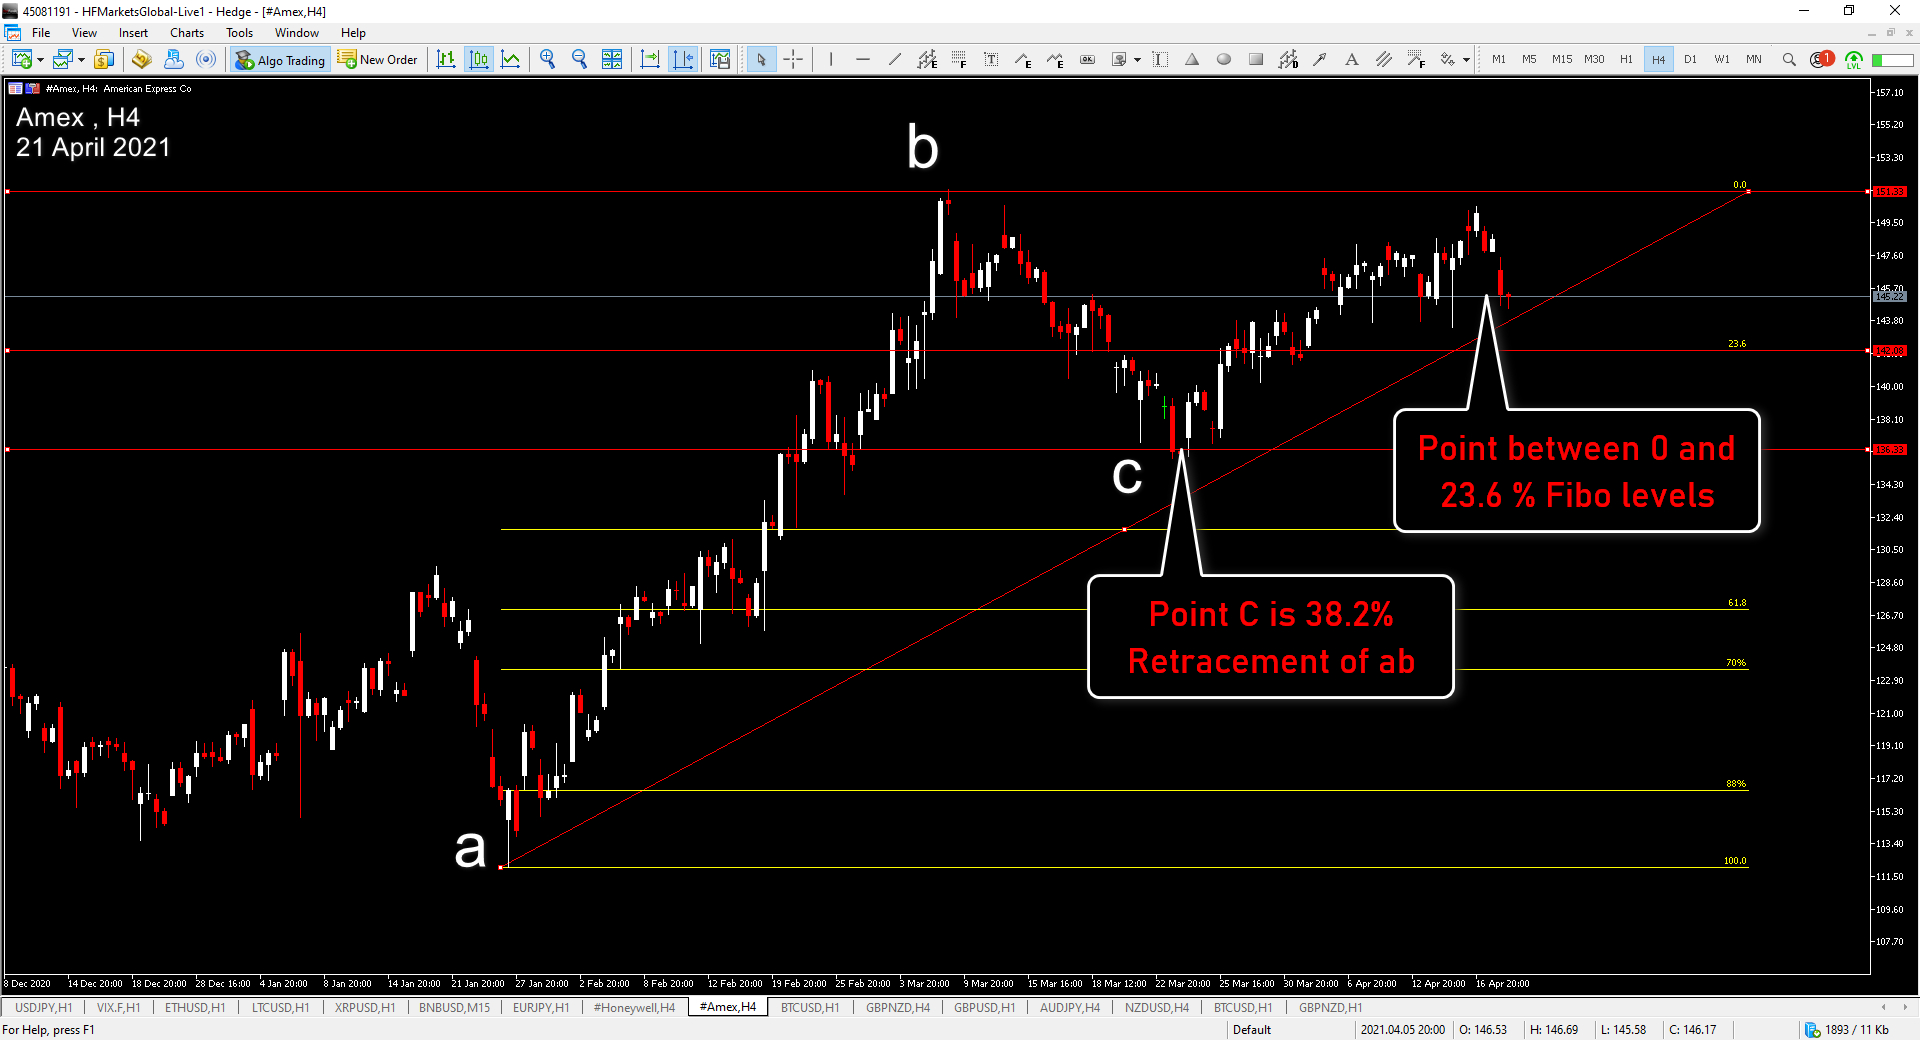
Looking at wave a-b between the lows and the tops, the C-point retracement was about 38.2% of ab, with the price turning higher to 23.6% Fibonacci retracement levels. As shown in the chart, 23.6% at 142.14 represents Support in the near term, while next support is set at 136.39 (38.2% Fibonacci).
Click here to access our Economic Calendar
Eslam Salman
Market Analyst- Middle East
Disclaimer: This material is provided as a general marketing communication for information purposes only and does not constitute an independent investment research. Nothing in this communication contains, or should be considered as containing, an investment advice or an investment recommendation or a solicitation for the purpose of buying or selling of any financial instrument. All information provided is gathered from reputable sources and any information containing an indication of past performance is not a guarantee or reliable indicator of future performance. Users acknowledge that any investment in Leveraged Products is characterized by a certain degree of uncertainty and that any investment of this nature involves a high level of risk for which the users are solely responsible and liable. We assume no liability for any loss arising from any investment made based on the information provided in this communication. This communication must not be reproduced or further distributed without our prior written permission.


