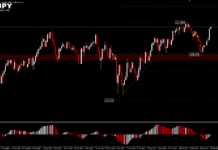
Overnight, the decline of the US Dollar against the offshore Renminbi (USDCNH) was suspended and closed slightly up 0.35% to 6.3736. In any case, the current currency pair is still under pressure below the 3-year low (6.3754). The factor that promotes the mild recovery of the US dollar against the Renminbi is the People’s Bank of China’s announcement that it will raise the foreign exchange deposit reserve ratio by 2 percentage points to 7% from June 15.
It can be seen from the PBoC’s restart of this policy policy 14 years ago and a larger adjustment range (previously an average of 0.5%) than before, that the authorities do not want to see the offshore RMB exchange rate against the US dollar continue to rise. The increase in the foreign exchange deposit reserve means that the liquidity or supply of foreign currency (USD) will be reduced, thereby achieving the purpose of hedging the appreciation of the Renminbi and stabilizing the exchange rate.
In any case, during the Asian trading session today, the US Dollar fell against the offshore Renminbi under pressure and recorded a decline of 0.1% in just 4 hours. The market’s short momentum still seems to show no signs of easing. The weakness of the US dollar is all related to US fiscal and monetary policy. Since the outbreak of the pandemic, the “unlimited monetary easing” adopted by the Fed has paved the way for the weakness of the US Dollar. Although the US economy has gradually returned to the right track with the acceleration of vaccination, the Fed did not express its willingness to reduce the scale of its debt purchases earlier. On the contrary, during the same period, other major central banks such as the Bank of Canada, the Bank of England, and the Reserve Bank of New Zealand have issued signals to gradually tighten their monetary policies. In this significant contrast, the US Dollar will inevitably become the weaker major currency. Not only that, but a series of plans launched by the Biden administration will also lead to a continuous expansion of the budget deficit, thereby exacerbating the downside risks of the US Dollar.
Currently, as many as 24 countries have opened the path to de-dollarization. Among them, Russia, which has heated up tensions with the United States, is more active in reducing its share of US Dollar holdings. In the Q4 2020, the US Dollar accounted for 48.3% of Russia’s export settlement, which was the first time in history that it fell below 50%. In addition, IMF data also showed that in the fourth quarter of last year, the share of the US Dollar in global foreign exchange reserves had hit the lowest level in nearly 25 years, at 59%. These data all reflect the weak demand for the US Dollar, and its status as a global reserve currency has also been threatened.
As the US economy is back on track (including the service industry that has been more severely affected by the pandemic), inflation data including core PCE exceeded the target level and hit a new high since 1992, at 3.1%, and CPI hit 2008 The new high since September 2009 is 4.2%.
This week the market will also focus on the performance of US employment data. Recent non-agricultural reports show that too many stimulus measures and unemployment assistance have made local low-income groups reluctant to return to employment, which is obviously not conducive to stable economic growth. As many states in the United States have adjusted their unemployment compensation plans, this may encourage more Americans to return to work. When employment data continues to improve for a period of time, it may not be far from the day when the Fed will withdraw from the quantitative easing policy.
Technical Analysis:
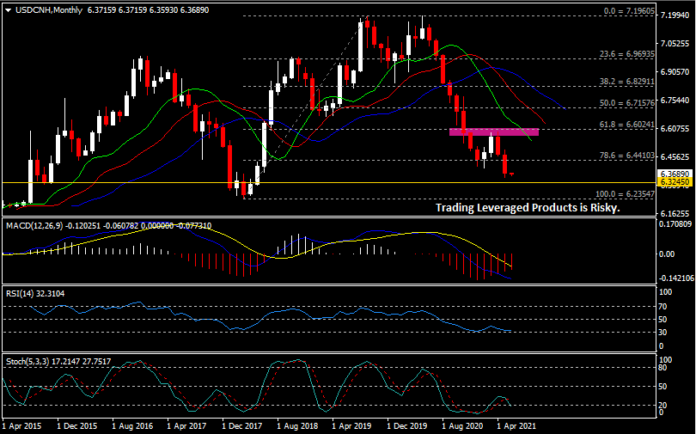
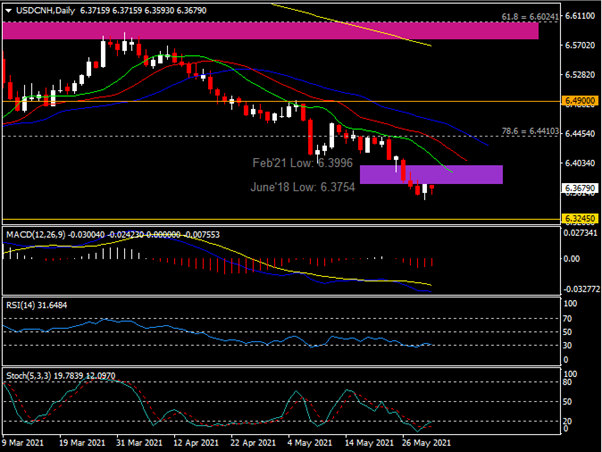
In June 2020, the USDCNH began a strong downward trend. The currency pair has fallen from a high of 7.1504 to the lowest level of 6.4873 in December of the same year, and has fallen by more than 10% in half a year. The trend continued until February of this year. The currency pair rebounded from a low of 6.3996 to a high of 6.5826 seen in March. In April, the exchange rate broke the March high in a short-term and recorded 6.5869, and then fell breaking February low (6.3996) and June 2018 low (6.3754). These two levels, plus the lips (green) of the Alligator indicator (6.5376) are the key resistance areas in the near term. If the breakout is successful, the exchange rate will continue to explore the teeth (red) (6.4063) and jaws (6.4271) of the Alligator indicator and the 78.6% Fibonacci retracement level extending from the low in March 2018 to the high in September 2019 6.4410. However, if the breakout fails, the exchange rate may continue its short momentum and test 6.3245 and the 2018 annual low of 6.2355.
In terms of indicators, MACD is in a negative configuration; Relative Strength Index (RSI) and Stochastics are maintained in the oversold area, the latter has just formed a golden cross.
Click here to access our Economic Calendar
Larince Zhang
Regional Market Analyst
Disclaimer: This material is provided as a general marketing communication for information purposes only and does not constitute an independent investment research. Nothing in this communication contains, or should be considered as containing, an investment advice or an investment recommendation or a solicitation for the purpose of buying or selling of any financial instrument. All information provided is gathered from reputable sources and any information containing an indication of past performance is not a guarantee or reliable indicator of future performance. Users acknowledge that any investment in Leveraged Products is characterized by a certain degree of uncertainty and that any investment of this nature involves a high level of risk for which the users are solely responsible and liable. We assume no liability for any loss arising from any investment made based on the information provided in this communication. This communication must not be reproduced or further distributed without our prior written permission.


