


NZDUSD, Daily
New Zealand’s GDP increased 1.6% in the first quarter of 2021 following a revised 1.0% contraction in the previous period and compared to market expectations of a 0.5% increase. The services industry, which represents about 2/3 of New Zealand’s economy, grew 1.1% after rising 0.2% in the previous quarter. Primary industry (0.3% vs -0.8%) and goods-producing industry (2.4% vs -3.1%). On an annual basis, GDP increased 2.4% after a 0.8% contraction. This stronger GDP data shows New Zealand has managed to avoid a second pandemic recession.
The first quarter of this year, previously expected to be a difficult quarter for the New Zealand economy as the tourism industry struggled during the global lockdown that deprived the country of visitors, coupled with a border lockdown that lasted nearly 2 weeks in Auckland.
However, the service industry, which represents about 2/3 of New Zealand’s economy, made the largest contribution to the current GDP results (Including construction services, heavy construction and civil engineering, and residential building construction). Construction rebounded 6.6% after falling 8.4% in the December 2020 quarter.
The construction industry has returned to activity levels close to the historically high volume of residential building works contributing to overall activity. Source : Statsnz
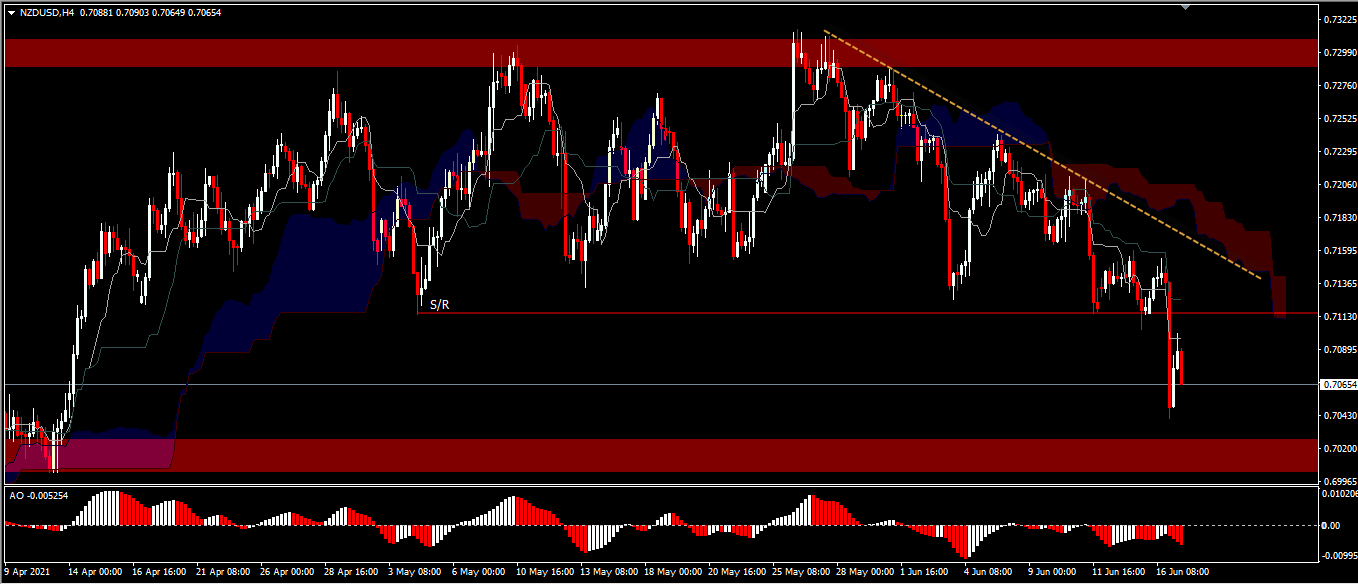
NZDUSD reverses 0.5% FOMC impact drop , after GDP report. But technically, the bears have been dominant. A break of the 0.7143 support strengthens the bearish position by targeting the immediate support and the psychological 0.7000 level and if strong will re-test the 0.6942 strong support level. A price move below 0.6942 would confirm a deeper correction to the 0.5467 rally that started in March last year. On the upside, as long as the 0.6942 support holds, further consolidation will continue below the 0.7143 resistance. Technical support for this asset can be seen from the price movement below KUMO which is in sync with the AO histogram bars on the sell side.
Click here to access our Economic Calendar
Analyst – HF Indonesia
Disclaimer: This material is provided as a general marketing communication for information purposes only and does not constitute an independent investment research. Nothing in this communication contains, or should be considered as containing, an investment advice or an investment recommendation or a solicitation for the purpose of buying or selling of any financial instrument. All information provided is gathered from reputable sources and any information containing an indication of past performance is not a guarantee or reliable indicator of future performance. Users acknowledge that any investment in Leveraged Products is characterized by a certain degree of uncertainty and that any investment of this nature involves a high level of risk for which the users are solely responsible and liable. We assume no liability for any loss arising from any investment made based on the information provided in this communication. This communication must not be reproduced or further distributed without our prior written permission.


