


The latest Federal Reserve FOMC resolution has brought greater volatility to various markets. According to the dot plot, most committee members (13) expect the central bank to raise interest rates twice in 2023. In addition, the statement also stated that the Fed will raise the excess reserve interest rate (IOER) and the overnight reverse repurchase interest rate to 0.15% (previously 0.1%) and 0.05% (previously 0.0%), and the policy will take effect immediately (today).
Affected by the above hawkish statement, even though the committee members stated that they will maintain the benchmark interest rate (0.0% to 0.25%) and maintain the $120 billion bond purchase plan, even Chairman Powell tried to downplay “The central bank did not officially talk about reducing the size (Taper)”, “There are still risks in the prospects for recovery”, “It is still too early to raise interest rates”, “The high degree of uncertainty in dot plots is not conducive to the prediction of future interest rate trends”, but the market has anchored the Fed’s hawkish statement.
In addition, policymakers are also optimistic about economic expectations from 2021 to 2023. In terms of GDP, the Fed raised its forecasts for 2021 and 2023 to 7.0% and 2.4%, respectively, from 6.5% and 2.2% before; and to remain unchanged at 3.3% in 2022. As for the unemployment rate, it is expected to record 4.5% in 2021 (consistent with expectations in March). However, the data is expected to fall to 3.8% in 2022 (previously 3.9%) and reach 3.5% in 2023. In terms of inflation, PCE and core PCE are expected to rise above 3.0% this year, but will remain at 2.1% to 2.2% in 2022 and 2023.
The most direct impact on the foreign exchange market after the FOMC resolution is that it opened a feast for the Dollar bulls. As of the close, the USDIndex surged to the 91 level (91.36), for the first time since May 6. The major currencies were under pressure against the US Dollar, with intraday drops ranging from 0.8% to 1.6%; Gold plummeted by nearly $60 to a low of $1803.39 (a new low in 5 weeks).
In the Oil market, the higher US Dollar also drove USOIL to fall under pressure. It is worth noting that following the Fed’s FOMC, the oil market will usher in new events that may change its mid-term to long-term trend. Tomorrow (June 18th), Iran’s 13th presidential election will proceed as scheduled. With the abdication of current President Hassan Rouhani imminent, in the list of candidates, there are reports that the conservative and principled politician, Chief Justice Ebrahim Raisi, is in a leading position. Therefore, if nothing goes wrong, the next Iranian president will be a hardliner, which will hinder the US-Iran nuclear negotiations to reach a consensus agreement (and possibly even terminate). The latest 1.5 to 2 million barrels of crude oil supply may be put off.
On supply and demand perspective, the factors supporting the upward trend of USOIL prices include the gradual opening of multinational economies (including the rebound in demand from India, which was severely affected by the pandemic), the decline in US API and EIA inventories, and the slowdown in oil rig exploration (although it has been in the fourth quarter of last year, it recorded a slow increase from a low to 342, but overall it only reached about 50% of the peak in March last year), European and Chinese refineries increased their crude oil processing capacity, etc.
As for downside risks, people are currently paying attention to the development of variant viruses. The latest research found that existing vaccines fail to provide complete protection against the new Indian delta strain. In the UK, a report last week indicated that 5% of people who had received two doses of the vaccine were still diagnosed with the virus. At the same time, the number of new viral infections in the UK showed an upward trend and reached a high level since February. The highest number of new cases in a single day was 7,752. Therefore, the effectiveness of existing vaccines may decrease as the virus continues to mutate, which may exacerbate the prospect that the global economic opening may be delayed.
USOIL – Daily
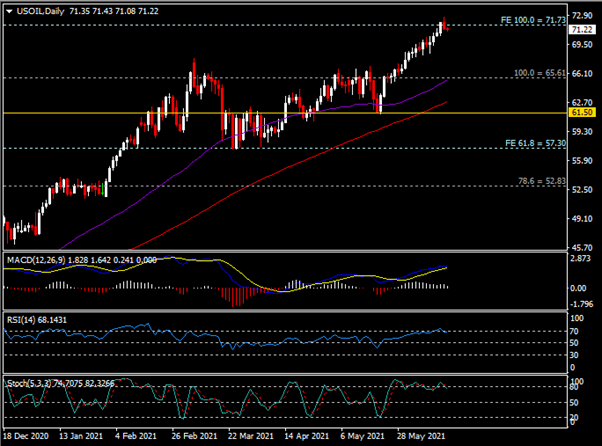
After setting a new high since October 2018 ($72.68), even if the API and EIA inventory data fell more than expected (respectively a decrease of 8.537 million barrels (expected to reduce 3.0 million barrels) and a decrease of 7.355 million barrels (expected to reduce 3.29 million barrels), USOIL prices came under pressure yesterday by the rising US Dollar recording a decline of more than 1.8% to $71.34 per barrel, however it reverted close to $72 so far today.
At present, the $71.70-$72.70 is a key resistance area in the short term. The double moving averages (50-DMA (purple) and 100-DMA (red)) are moving below the price as presented in the short- and medium-term. However, by considering that the current USOIL price is in a strong resistance area, the MACD moving average is approaching to form a death cross, while the RSI and Stochastics are in the overbought area (the latter also formed a death cross, implying that in the short-term bullish momentum may have slow down, as long term outlook remains positive.
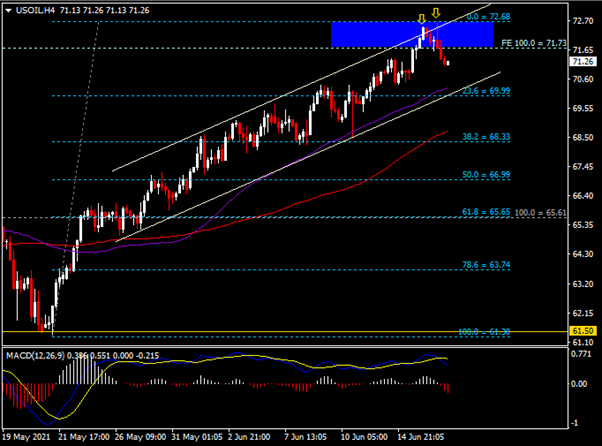
The intraday chart (4-hour) shows that USOIL prices have been trading in the ascending channel for nearly a year. Yesterday, the second test of the upper trend line of the channel was unsuccessful. The 50-period SMA (purple) is below the price, while along with the lower line of the 1-month channel, and the round $70.00 level (23.6% Fibonacci Retracement Level) all three provide a strong Support area for the asset.
Tomorrow, Iranian election results may have a longer-term impact on USOIL prices. If USOIL breaks through the key resistance area of $71.70-$72.70, USOIL is likely to continue the upward trend and test the high of $75.50 and the high of $76.88 seen in October 2018; however, if it falls below the key support area of $70.00, then is could retest the 100-period SMA (red), $68.30 (38.2% Fibonacci retracement level) and $67.00 (50.0% Fibonacci retracement level).
Click here to access our Economic Calendar
Larince Zhang
Regional Market Analyst
Disclaimer: This material is provided as a general marketing communication for information purposes only and does not constitute an independent investment research. Nothing in this communication contains, or should be considered as containing, an investment advice or an investment recommendation or a solicitation for the purpose of buying or selling of any financial instrument. All information provided is gathered from reputable sources and any information containing an indication of past performance is not a guarantee or reliable indicator of future performance. Users acknowledge that any investment in Leveraged Products is characterized by a certain degree of uncertainty and that any investment of this nature involves a high level of risk for which the users are solely responsible and liable. We assume no liability for any loss arising from any investment made based on the information provided in this communication. This communication must not be reproduced or further distributed without our prior written permission.


