


According to the CFTC Commitments of Traders report for the week ended June 22, NET LONG gold futures dipped -25,822 contracts to 166,214 while NET LONG silver futures were down -12,193 contracts to 39,871. For other metals, NET LONG Platinum futures fell -7,117 contracts to 12,940 while Palladium fell -1,331 contracts to 1,072.
Gold had traded in a tight range last week, edging up just 0.93% after a 6% decline the previous week. The mixed message from the Fed on interest rate expectations was partly the cause of the choppy trading seen on XAUUSD. Initial jobless claims and a miss for durable goods data offered some support for the precious metal. However, the Biden infrastructure deal has boosted risk sentiment which has hit gold’s safe-haven appeal.
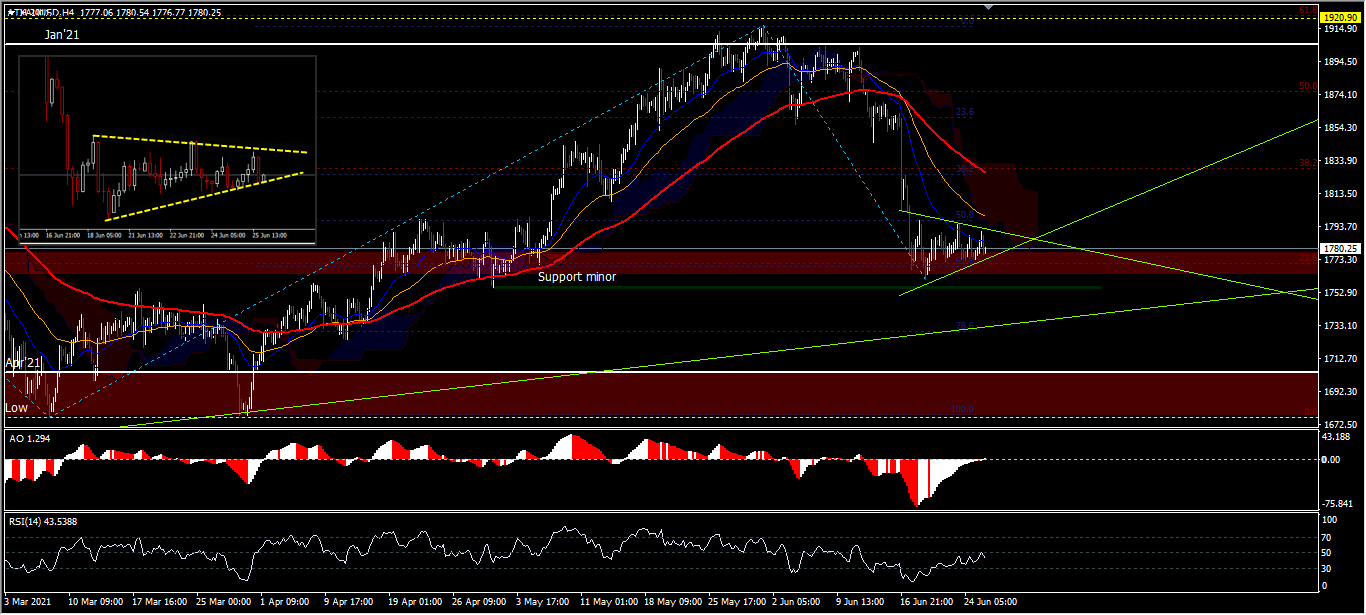
Technical Levels
The signal that supports an increase in the price of XAUUSD this week is the up trendline. If this trendline holds, the rebound is likely to occur again. The price pattern formed temporarily in the consolidation of the pennant pattern below the 26 EMA (blue) and above the minor support 1756.10. A break of this support would re-test 2 support levels, namely 1723.63 near the trendline and the double bottom low of 1676.77. Cancellation of the gold strengthening option will occur if the up-trendline is broken to the downside, which would confirm the continued decline with the nearest target of the March low and 1617 level (50.0% FR from drawdown 1160.22-2075.08).
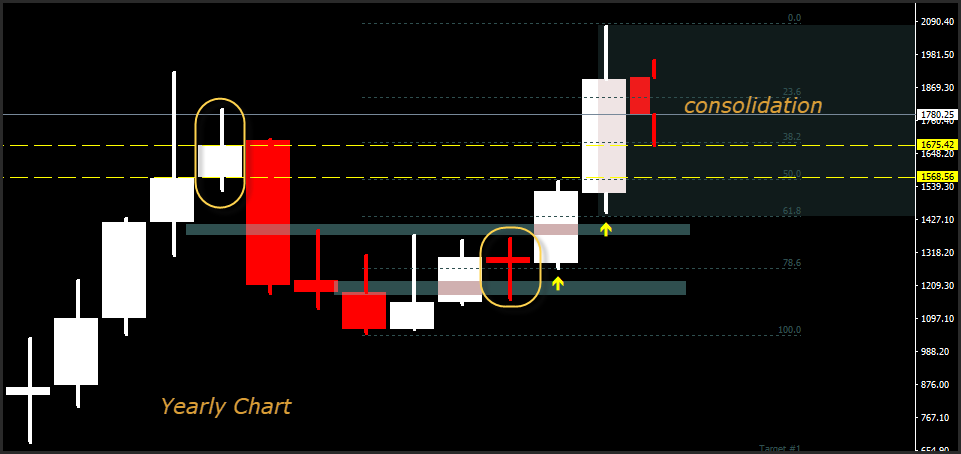
The monthly price chart may trigger a longer term sell signal, if at the end of the month the price closes perfectly below the May opening price. Thus it will form a bearish engulfing pattern as a reversal formation. But the support of the March low price will still be the determinant as to whether the asset will make a deeper correction or bounce back upwards.
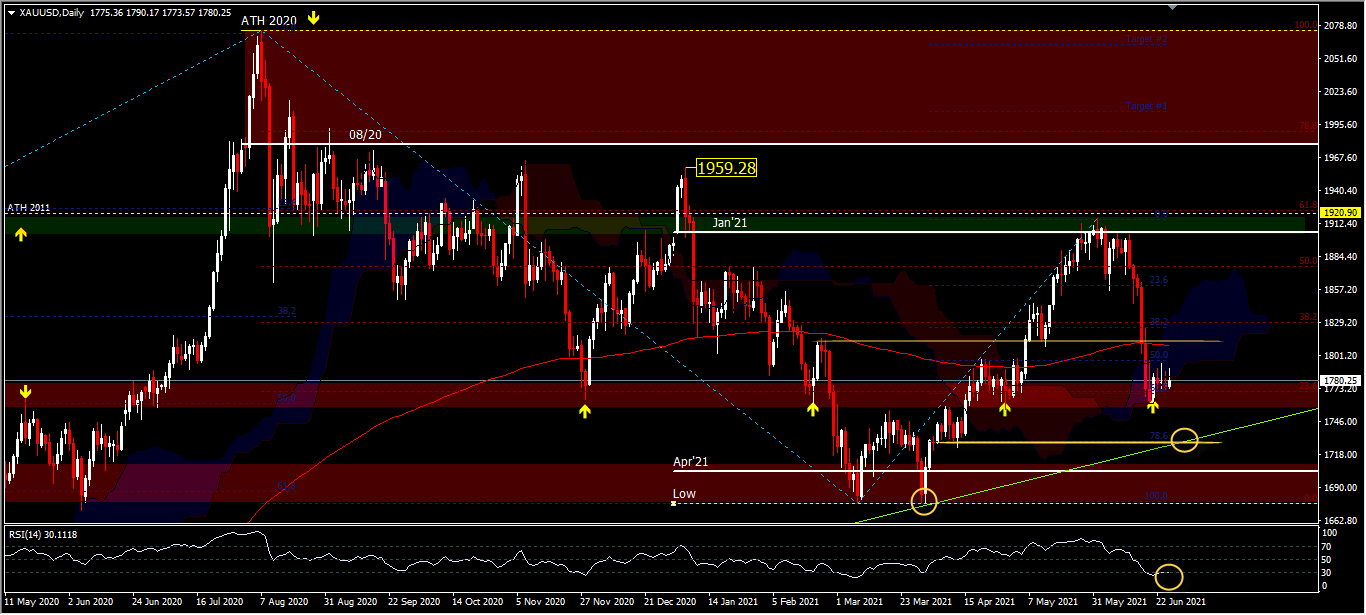
Support comes from the up trendline near the price level of 1723.63 (78.6% FR) and the low of the previous double bottom pattern at 1676.77. A decline in price below these 2 support levels would confirm a much deeper retracement to the 1617.00 and 1582.00 price levels. The price moving average is below the 200-day EMA, the RSI OS at 30.11 levels. As long as the support at 1676.77 holds, the trend will still point to the upside. Immediate resistance seen is at 1797.21; a break of this level would see price positions return to the upside at 1825.16 and price tops decline to 1916.50, below the 2011 ATH high.
Click here to access our Economic Calendar
Ady Phangestu
Market Analyst
Disclaimer: This material is provided as a general marketing communication for information purposes only and does not constitute an independent investment research. Nothing in this communication contains, or should be considered as containing, an investment advice or an investment recommendation or a solicitation for the purpose of buying or selling of any financial instrument. All information provided is gathered from reputable sources and any information containing an indication of past performance is not a guarantee or reliable indicator of future performance. Users acknowledge that any investment in Leveraged Products is characterized by a certain degree of uncertainty and that any investment of this nature involves a high level of risk for which the users are solely responsible and liable. We assume no liability for any loss arising from any investment made based on the information provided in this communication. This communication must not be reproduced or further distributed without our prior written permission.


