


United Health Group Inc (#UnitedHealth ) is the second largest healthcare company in the world and the most diversified healthcare company in the US; it provides a wide range of healthcare products and services like healthcare coverage and benefit services and also applies technologies to improve access to health and wellbeing services through its 4 subsidiaries – UnitedHealthCare, OptumHealth, OptumInsight and OptumRX – with over 330,000 employees across the world. Ranked 5th in the Fortune 500 with a market cap of $384.66B, the health care giant is set to release its Q2 2021 earnings report this Thursday (July 15) before market open.
#UnitedHealth is expected to post quarterly earnings of $4.40 EPS, down 38.2% y/y, and revenue of $69.55B, up 11.9% y/y, according to Zack’s consensus estimate. Despite this mixed expectation and the Zack’s Most Accurate Estimate unchanged at $4.40 EPS, indicating no revisions by analysts, the company has managed to maintain a #2 buy on the Zack ranking. Over the last 4 quarters, #UNH has beat the consensus Earnings/share every single time, with the latest release beating estimates by 20.14% ($5.31 EPS against $4.42 EPS expected),, which puts focus on the deviation from expectation for the release. Although the unprecedented amount of monetary stimulus and low interest rates should prove supportive for companies like #UnitedHealth, 22 analysts from Yahoo finance research estimate a buy and strong buy bias on the share price while Trefis values the 44 year old company at $422, above the current market price.

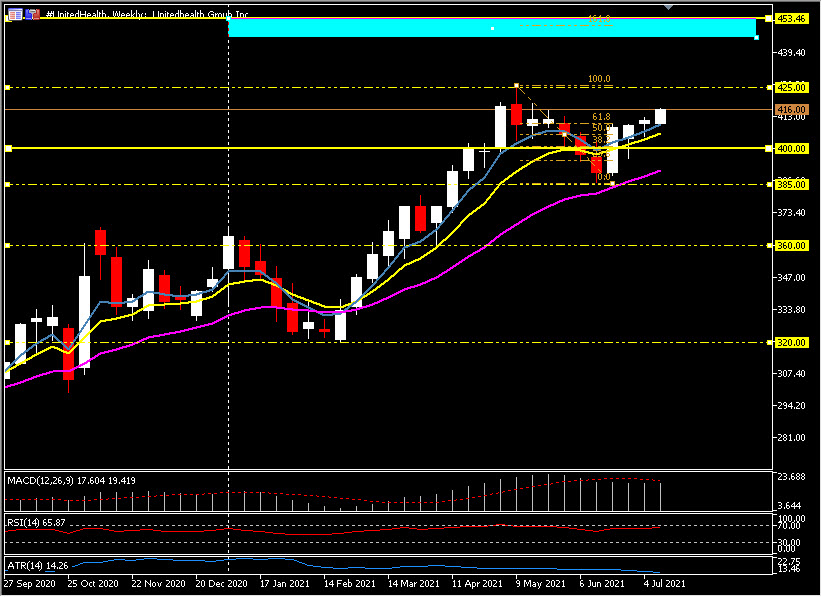
Technically, #UnitedHealth maintains a bullish trend, having risen almost 16% from 2020 highs to create a fresh ATH around $425; it is currently trading around $416 (above the 20 SMA and 50 SMA). May highs at $418 serve as the immediate resistance level and if broken, the $425 ATH will be the next stop if expectations are beat by a good variance. Technically, the next key Fibonacci levels the 261.8 (from the January-February decline) and the 161.8 (from the May-June decline) creates a new target zone $445-453.
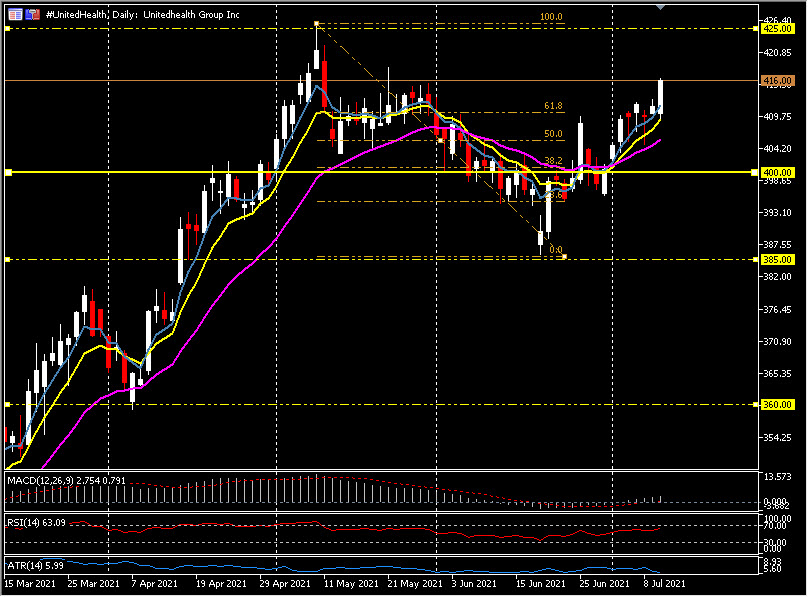
On the other hand, a miss in the numbers could see the share price dip from these high levels – an excuse for profit taking – towards the 20 SMA and 50.0-38.2 Fib zone at $405-400. Below here is the June low at $385, the April low at $360 and the 2021 low from February at $320.
Click here to access our Economic Calendar
Market Analysis Team
Disclaimer: This material is provided as a general marketing communication for information purposes only and does not constitute an independent investment research. Nothing in this communication contains, or should be considered as containing, an investment advice or an investment recommendation or a solicitation for the purpose of buying or selling of any financial instrument. All information provided is gathered from reputable sources and any information containing an indication of past performance is not a guarantee or reliable indicator of future performance. Users acknowledge that any investment in Leveraged Products is characterized by a certain degree of uncertainty and that any investment of this nature involves a high level of risk for which the users are solely responsible and liable. We assume no liability for any loss arising from any investment made based on the information provided in this communication. This communication must not be reproduced or further distributed without our prior written permission.


