USA500, Daily & Weekly
The Fed’s loose monetary policy, vaccination and economic opening, the release of consumer demand, the strong earnings performance of most companies, and the optimistic shift in market sentiment-these factors continue to push the S&P500 index higher. Since the outbreak of the pandemic, the index has rebounded from a low level and has so far risen by more than 100%, closing at 4447 overnight.
The current index trend reflects that concerns about the Delta variant virus, recent regulators’ suppression, and the Fed’s possible reduction of stimulus have still not had a meaningful negative impact on the stock market. In addition, although the military conflict in Afghanistan has triggered some safe-haven buying (the US dollar index closed slightly up by about 0.12% yesterday to 92.56), the current stock market has not shown any significant signs of correction, and optimism has not been shaken. This can also be verified from the VIX index, which measures the implied volatility of the S&P500 index. As of yesterday’s close, VIX.F recorded an 8th consecutive decline to 17.07, approaching a 1-month low (16.77). In view of the future trend of the S&P 500 index, research firm Yardeni),predicts that as long as the United States avoids falling into a large-scale economic blockade, continued productivity growth will be expected to drive growth. The index will reach 5000 at the end of next year is a relatively conservative estimate.
In terms of the pandemic, although the recent Delta virus outbreak has caused more than 98% of the US area to become a high-level transmission risk in just one month (previously 19%), industry insiders believe that the US is unlikely to restart a large-scale pandemic. Restrictive measures, at most, the state government may re-regulate people to wear masks and must provide proof that they have been vaccinated before they can engage in activities or outdoor dining, instead of directly shutting down economic activities. Therefore, the recent pandemic rebound may not have a significant negative impact on the US economic recovery.
Later this week, market participants will focus on Fed Chairman Powell’s speech and the minutes of the Fed’s meeting. According to the “Wall Street Journal” report, if the economy continues to recover, the central bank will begin to reduce loose monetary policy in about three months (i.e. before the end of the year), and end the asset purchase plan before the middle of next year-this may add downside risks to US stocks . On the other hand, up to now, the Fed and Chairman Powell have maintained a relatively dovish stance on policy. As long as they did not make a major change in their wording this week, the stock market will still be supported by the bulls.
Technical Analysis:
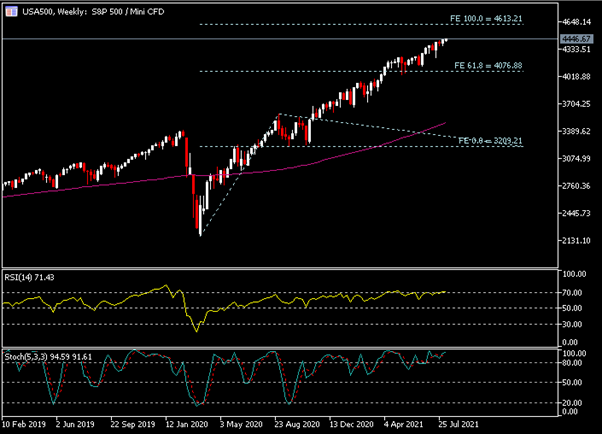
Judging from the weekly chart, the USA500 has started a steady upward trend since stabilizing in late March last year. The current closing price is more than 960 points below the 100-SMA (3483). After recording a rebound in the week of last November and the bullish candle closing above 3210, the index continued its upward pattern and broke through 4077 (or FE 61.8%). It is currently only about 166 points away from the nearest resistance of 4613. In terms of technical indicators, since the index stabilized and rose in November last year, the Relative Strength Index (RSI) and Stochastics (Stochastics) have both fluctuated in the 50 to overbought region.
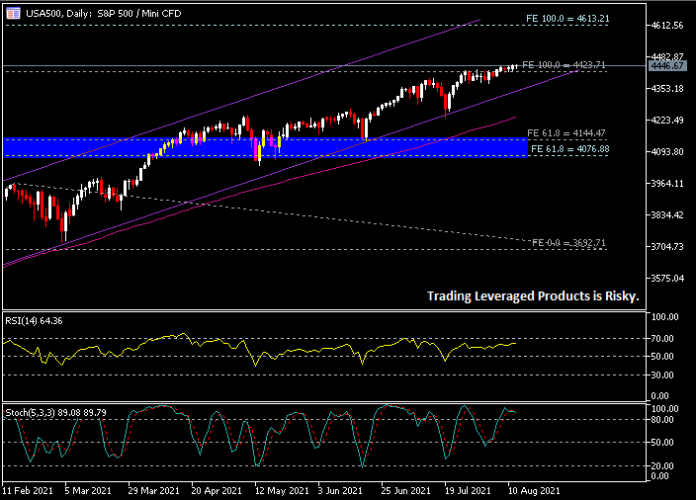
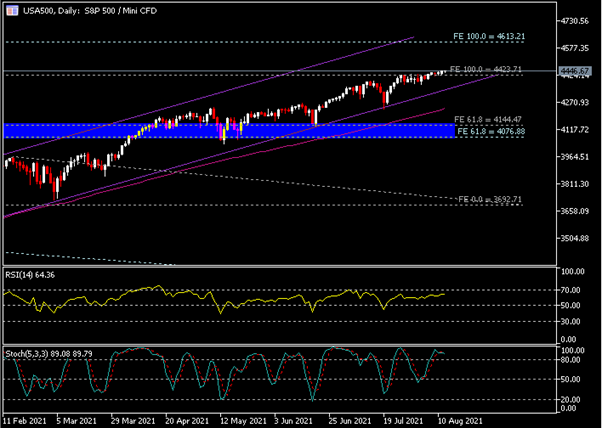
On the daily chart, the USA500 index is trading in an ascending channel and is currently testing the 100% Fibonacci extension level of the cycle, or 4425 . A successful breakout means that the index is expected to continue the bullish pattern and test the next resistance, 4615 (or FE 100% on the weekly) and 4875 (or 161.8% on the daily FE). Yardeni predicted 5000 to 5155 (or 200.0% of the daily FE) is the fourth key resistance.
On the downside, if the index cannot stabilize above 4425, then the bottom line of the ascending channel will be the nearest support. A further break below the 100-day moving average may indicate that the index will face a correction wave, and 4077 to 4145 will be the key support area.
Click here to view the HotForex economic calendar
Larince Zhang
Market Analyst
Risk disclaimer: The content of this website is for general marketing communication purposes only, for reference only and does not constitute independent investment research. Any content on this website does not contain or should not be regarded as investment advice for buying and selling any financial instruments. The information provided on this website comes from reputable financial resources, and any information containing past performance indicators in the content cannot or reliably indicate future performance. All users should understand that any investment in leveraged products has a certain degree of uncertainty. Investments of this nature involve high risks and all users should bear full responsibility for this. We are not responsible for any losses caused by any investment made by users in the information provided on this website. Without our prior written permission, no content on this website may be reprinted or copied without permission.


