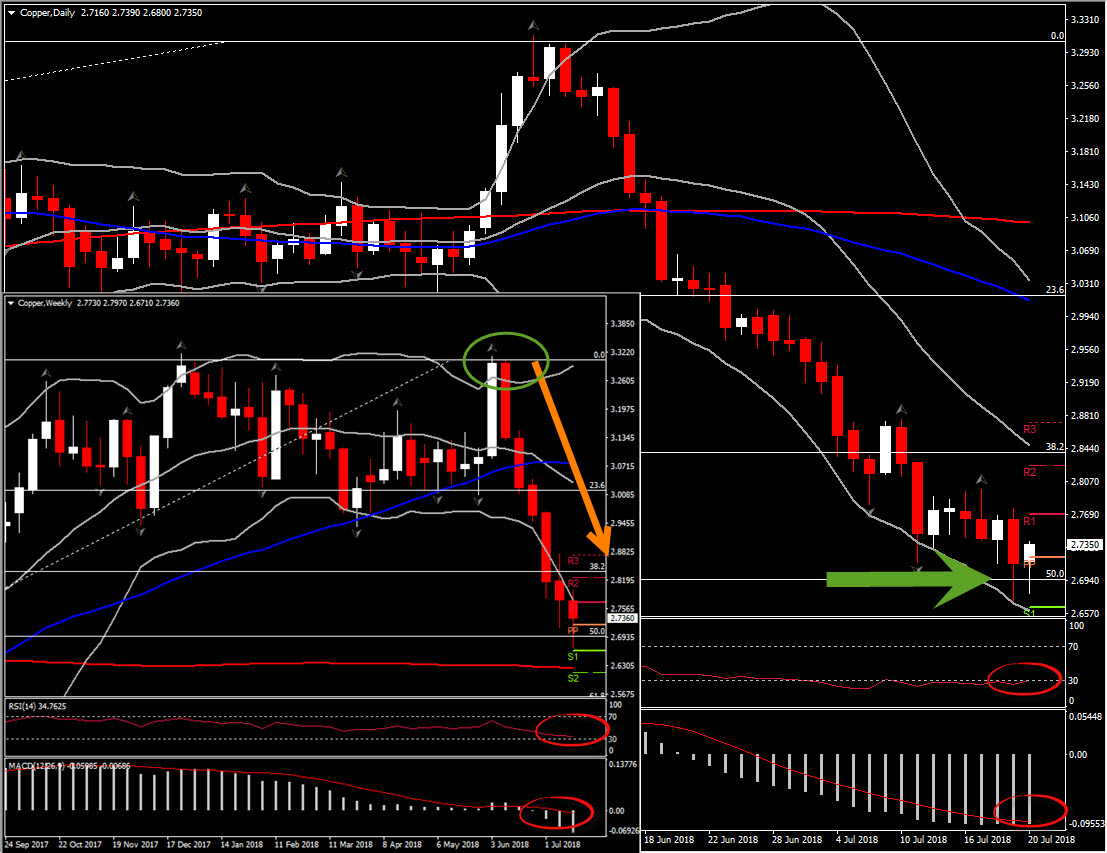
Copper, Daily & Weekly
Copper slumped through $6k/ton briefly to the lowest level of the year for an 18% decline from its peak in June as China continues its stealth devaluation of the Yuan and corporate debt comes under pressure in Asia amid trade war concerns. Other industrial metals have followed suit as the Dollar Index topped 95.65 year-highs earlier before pulling back to 95.40. There was a testy response from Chinese officials to the “duplicitous” NEC’s Kudlow characterizing China’s Xi as the main impediment to progress on trade. Some reports allege that CTAs are piling on short-positions as trade tensions mount. The USDCNH pair blew out to 6.783 from 6.719 lows to mark the weakest Yuan level in a year. The pair recovered more than 70% of the losses seen since December’s 2016 decline and hence then next Resistance comes at the Resistance at the 1st quarter of 2017, at 6.90-6.91.
The Copper, on the other hand, affected by the sharp decline in the Gold price since June 14, which had a ripple effect out to other commodities but most notably Copper this week. Dollar strength, as a result of Fed Chair Powell’s upbeat testimony on Tuesday and Wednesday, along with the deepening of trade war, have continuously weighed on commodity prices.
The Copper chart looked the most interesting as it is retesting for the 2nd consecutive day today below the 50% Fibonacci retracement level set since 2016’s rally. The asset declined for the 6th week, after the tweezer top formed at the beginning of June in the weekly chart. It is currently traded at 2.7360, while it extends its lower weekly & daily Bollinger Bands pattern further to the downside. The immediate Support comes at the 50% Fib. level at the 2.6900 level, which could also provide some short-term Support to a move lower. The weekly technical indicators suggest the continuation of the negative outlook as RSI is at 34 looking down and MACD turned negative while it is increasing above its signal line.
Therefore, a breakout below the 2.6900 will open the way towards the 200-week SMA at 2.6240 level and towards the 61.8% Fib. retracement level, at 2.5500.
The Daily timeframe retains a negative picture as well. The pair is traded at the lower Bollinger Bands pattern, creating lower lows and lower highs. It is currently traded slightly above its PP level. RSI is moving below the 30 barrier for the last 15 days while it is currently at 30.5 looking that it is not oversold and hence there is further steam to the downside. MACD oscillator increases above its trigger line within the negative area, suggesting that negative momentum increases. Daily Resistance levels come at 2.7700 and 2.8250, while Support levels are set at .6640 and 2.6150.
Fundamentally, Copper is in a strong bear market and hence any swing higher in the daily timeframe could be treated as a correction to the longer term negative view.
Click here to access the HotForex Economic calendar.
Want to learn to trade and analyse the markets? Join our webinars and get analysis and trading ideas combined with better understanding on how markets work. Click HERE to register for FREE! The next webinar will start in:
[ujicountdown id=”Next Webinar” expire=”2018/07/24 14:00″ hide=”true” url=”” subscr=”” recurring=”” rectype=”second” repeats=””]
Andria Pichidi
Market Analyst
HotForex
Disclaimer: This material is provided as a general marketing communication for information purposes only and does not constitute an independent investment research. Nothing in this communication contains, or should be considered as containing, an investment advice or an investment recommendation or a solicitation for the purpose of buying or selling of any financial instrument. All information provided is gathered from reputable sources and any information containing an indication of past performance is not a guarantee or reliable indicator of future performance. Users acknowledge that any investment in FX and CFDs products is characterized by a certain degree of uncertainty and that any investment of this nature involves a high level of risk for which the users are solely responsible and liable. We assume no liability for any loss arising from any investment made based on the information provided in this communication. This communication must not be reproduced or further distributed without our prior written permission.


