EURGBP, H1 and Daily
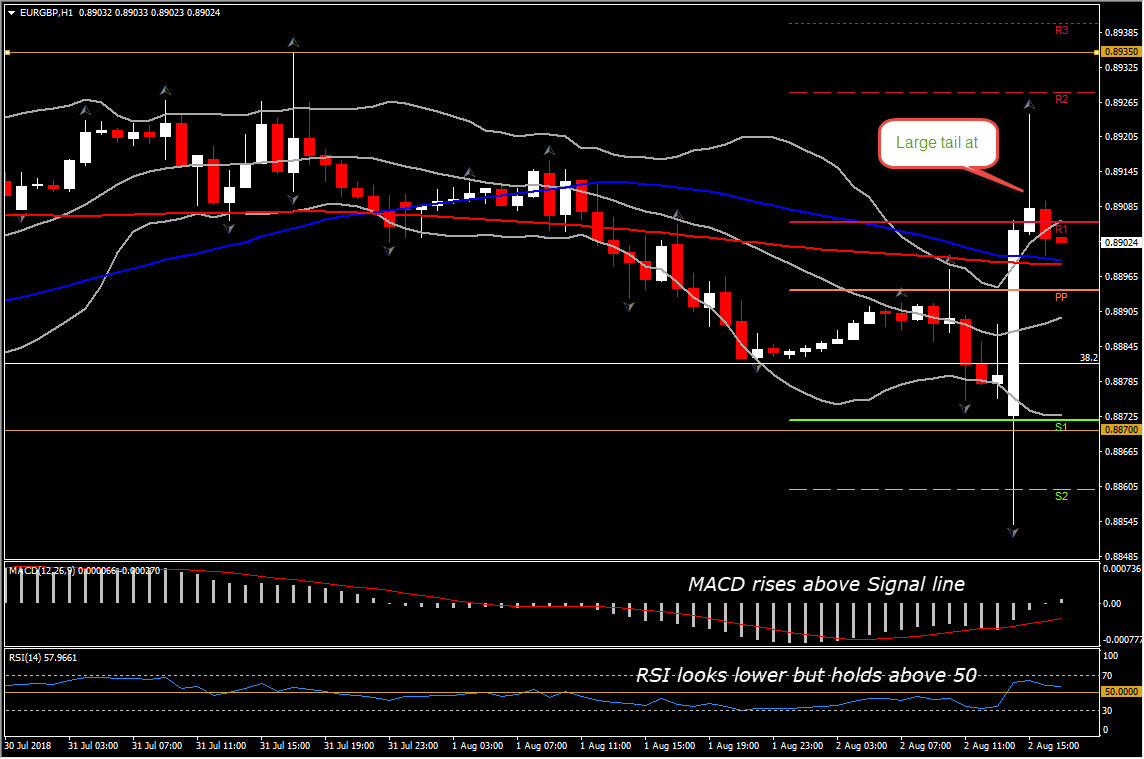
EURGBP has rallied by over 50 pips from its lows in returning above 0.8924. As the Pound had initially rallied on the unexpected unanimous decision of the 9-member MPC to hike the repo rate for a 2nd time in a decade, taking the policy rate to 0.75%, EURGBP drifted to 0.8850. The Sterling however has turned lower afterwards, on BoE’s circumspect guidance, which has put particular emphasis on Brexit-related uncertainty, boosting EURGBP just a breath below the R2 at 0.8928.
This, along with the rejection of R2, end up with a long large tail on the top of the hourly candlestick, suggesting that upward movement might run out of steam. In contrast, the momentum indicators suggest that positive momentum is likely to continue in the short term, along with the fact that the pair remains above the 20-, 50- and 20- EMA in the H1 chart. RSI is above 50 level, while the MACD oscillator reached neutral zone above its trigger line. Therefore so far, the short term supports the upside swing with the next Resistance at 0.8935.
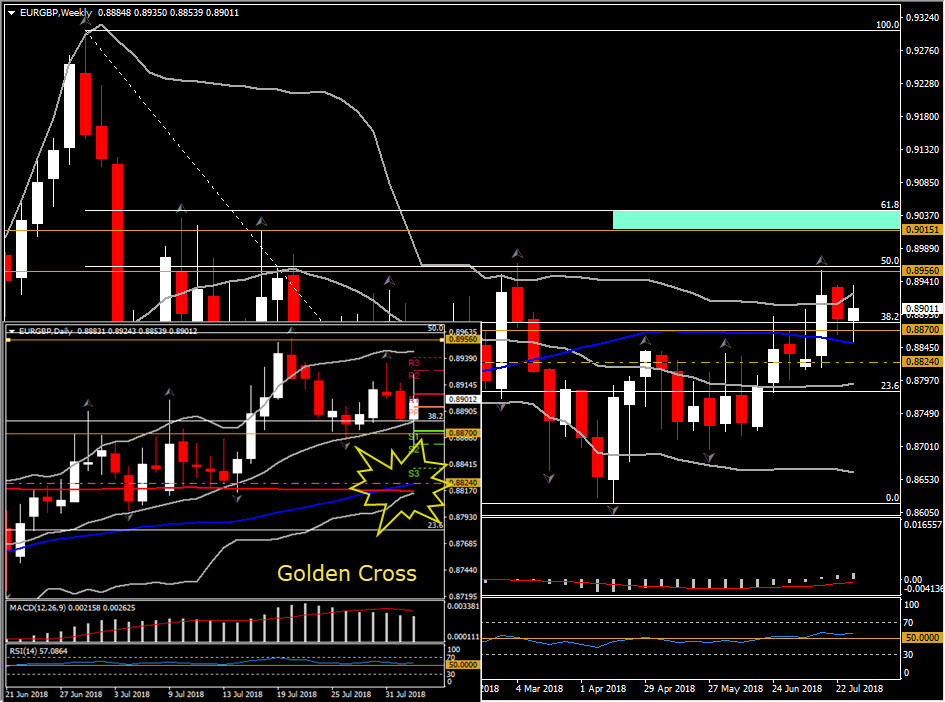
Shifting attention to our Daily charts, we see that bullish picture is supported, as RSI holds above 50 since end of June, whilst MACD lines are slightly lower than signal line but they hold well above zero zone. The indicator’s performance along with the rebound from 20-DMA and the confirmation of the Golden Cross (50 DMA moving above 200 DMA) yesterday, suggested further strength ahead for EURGBP in the long term.
Hence, if the pair continues to move northwards above R2 at 0.8935, a decisive break of last week’s peak at 0.8956, which also coincides with the 50% Fibonacci retracement level set since August 2017 peak, could open the doors for 0.9015-0.9040 barrier ( November 2017 peak – the 61.8% Fib. level).
If EURGBP fails to extend gains, then we may see a test of S1 at 0.8870. The S1 coincides with 3 low fractals in the 4-hour chart but also the 23.6% Fib. level since the rebound in April 17. Hence on the break below this Support level, the next handles are coming at 50- and 200-DMA, at 0.8824 and 0.8816 respectively.
Click here to access the HotForex Economic calendar.
Want to learn to trade and analyse the markets? Join our webinars and get analysis and trading ideas combined with better understanding on how markets work. Click HERE to register for FREE! The next webinar will start in:
[ujicountdown id=”Next Webinar” expire=”2018/08/07 14:00″ hide=”true” url=”” subscr=”” recurring=”” rectype=”second” repeats=””]
Andria Pichidi
Market Analyst
HotForex
Disclaimer: This material is provided as a general marketing communication for information purposes only and does not constitute an independent investment research. Nothing in this communication contains, or should be considered as containing, an investment advice or an investment recommendation or a solicitation for the purpose of buying or selling of any financial instrument. All information provided is gathered from reputable sources and any information containing an indication of past performance is not a guarantee or reliable indicator of future performance. Users acknowledge that any investment in FX and CFDs products is characterized by a certain degree of uncertainty and that any investment of this nature involves a high level of risk for which the users are solely responsible and liable. We assume no liability for any loss arising from any investment made based on the information provided in this communication. This communication must not be reproduced or further distributed without our prior written permission.


