


XAUUSD, H1 & Daily
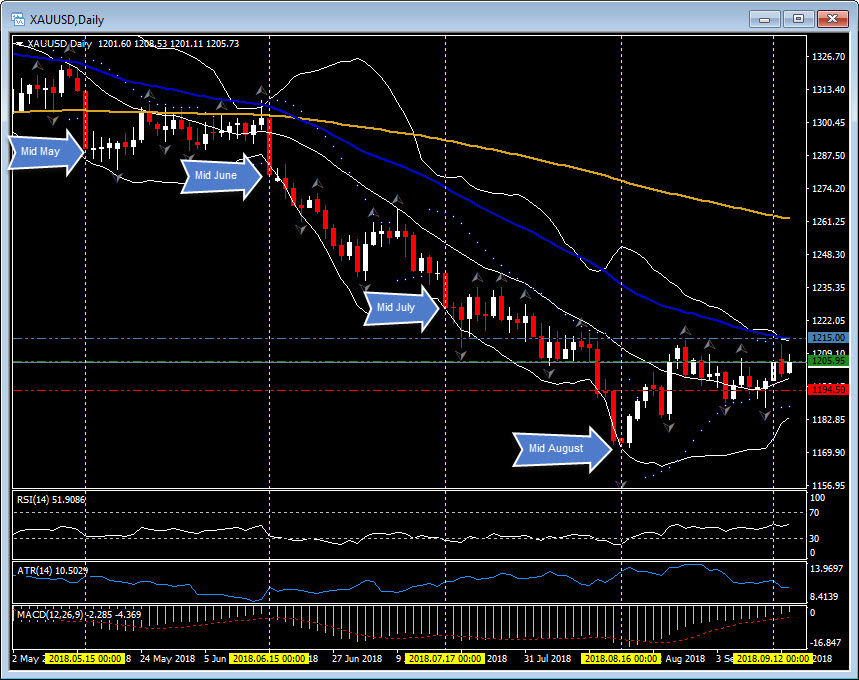
Gold prices peaked at 1212.60 yesterday before a sharp decline to the key 1200.00 level and then turned positive again during the Asian trading session. So far today, the bid has continued and topped at 1208.50, with first Resistance (R1) at $1209.20 and Support at the daily pivot point $1204.50. The EMA Crossing Strategy triggered (1, 2, 3 & 4) at 06:00 today, the ATR (3) suggested a Target 1 (6) at 1207.07 with a stop loss around the turn in the market (5) at 1202.00 and a weak risk reward of 1.
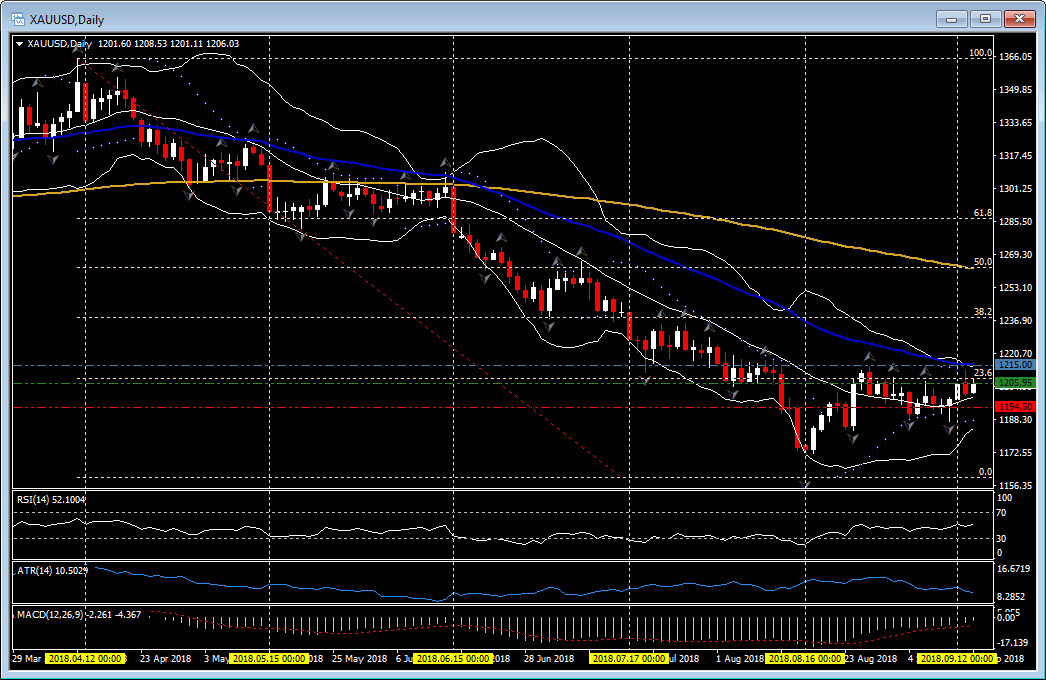
On the higher daily time frame the gold price has held north of it’s key 20 day moving average all week. Today we are are half way through the trading month, which has marked a key point in the gold market so far this year. Mid-April (Wednesday April 11) marked a 2018 high at 1365.25, the downtrend triggered the following week (Friday April 20) and ran until mid August (Tuesday August 16). Tuesday May 15, Friday June 15 and Tuesday July 17 all marked key trading days with large negative candles as the trend ran its course.
Today, Friday September 14, and the daily chart remains relatively positive, although in a sideways mode. Support is now at 1195.00 and 1185.00 with a strong resistance at 1215.00, where the upper Bollinger Band, 50 day moving average and the 23.6 Fibonacci level all coincide.
A break of these levels will be necessary for the next trend in the gold market. The close today and Midweek, next week, could be interesting.
Click here to access the HotForex Economic calendar.
Want to learn to trade and analyse the markets? Join our webinars and get analysis and trading ideas combined with better understanding on how markets work. Click HERE to register for FREE! The next webinar will start in:
[ujicountdown id=”Next Webinar” expire=”2018/09/17 14:00″ hide=”true” url=”” subscr=”” recurring=”” rectype=”second” repeats=””]
Stuart Cowell
Head Market Analyst
HotForex
Disclaimer: This material is provided as a general marketing communication for information purposes only and does not constitute an independent investment research. Nothing in this communication contains, or should be considered as containing, an investment advice or an investment recommendation or a solicitation for the purpose of buying or selling of any financial instrument. All information provided is gathered from reputable sources and any information containing an indication of past performance is not a guarantee or reliable indicator of future performance. Users acknowledge that any investment in FX and CFDs products is characterized by a certain degree of uncertainty and that any investment of this nature involves a high level of risk for which the users are solely responsible and liable. We assume no liability for any loss arising from any investment made based on the information provided in this communication. This communication must not be reproduced or further distributed without our prior written permission.


