


Bitcoin, Daily and Weekly
Is Bitcoin in for a roller-coaster ride?
Last November, Bitcoin had a remarkable spike from $5,650.00 area up to $11,482.00 that would imply the rise of the price 10-times more within a 6-month period. However the price reached a record high of $19,470 in the mid of December, before the reversal.
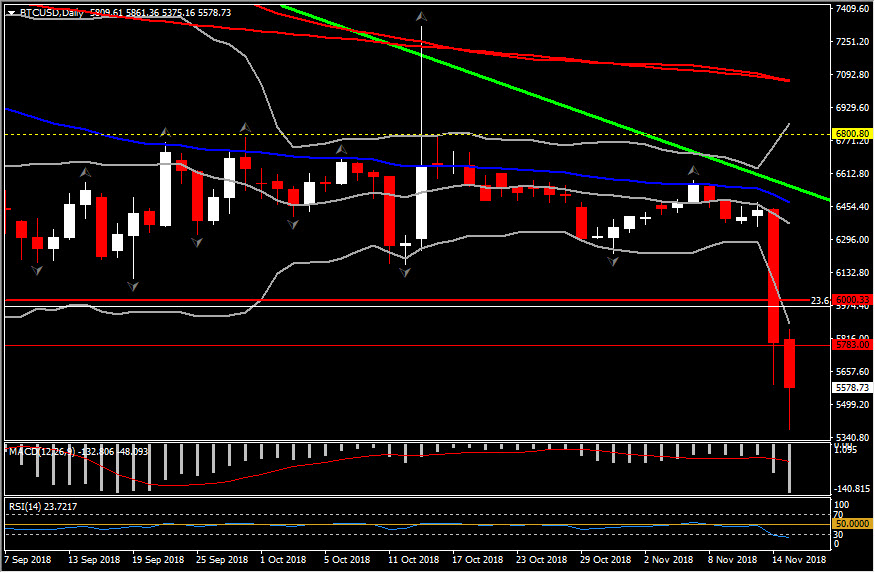
Since then, Bitcoin has been trading at 30% of its peak value, with continuously decreasing volatility, but keeping a constant floor for 2018 at around the $5,783.00 -$6,000.00 hurdle.
Compared to last year’s insane movement, the turmoil has gripped stocks, bonds, commodities and traditional currencies, leaving cryptos with low volatility. The current November has so far been represented by smooth and calm trading. Interestingly, the past 2 months Bitcoin has settled around $6,500, with a slow increase in the positive bias, something that has been interpreted by many analysts as a chance of seeing repetition of last year’s rally.
However today this scenario was proven wrong, as BTCUSD broke year’s low at $5,650.28 and is currently trading around $5,550.00, after posting a low at $5,504.47. The enthusiasm for a potential upswing in cryptocurrencies has been muted on today’s performance, which seems to have a really high volume, even greater than the volume seen between November 2017 and February 2018.
Along with Pound, Bitcoin seems to be today’s 2nd biggest mover of the day. With just 2% movement in October, November’s movement but more precisely today’s move plummeted bitcoin’s price more than 13% which comes in line with US stocks today. Today, US equities lost some upside momentum in pre-market trade, despite the mostly friendly mix of US data (ex-Philly Fed, which sank). Fast-moving headlines on Brexit have hijacked some market attention and kept investors on edge after UK banks suffered on the UK cabinet rebellion and Parliamentary reaction. Stocks were mixed around the globe, with Sino-related indices 1.1-1.75% firmer after Beijing formally responded to US trade demands, while the Nikkei sank 0.2% in Asia.
The similar performance of US stocks and Bitcoin is quite rare within 2018, and more precisely in the 2nd half of the year. In October US stocks faced the biggest drop seen in the past 7 years, in contrast with Bitcoin which faced remarkably low volatility.
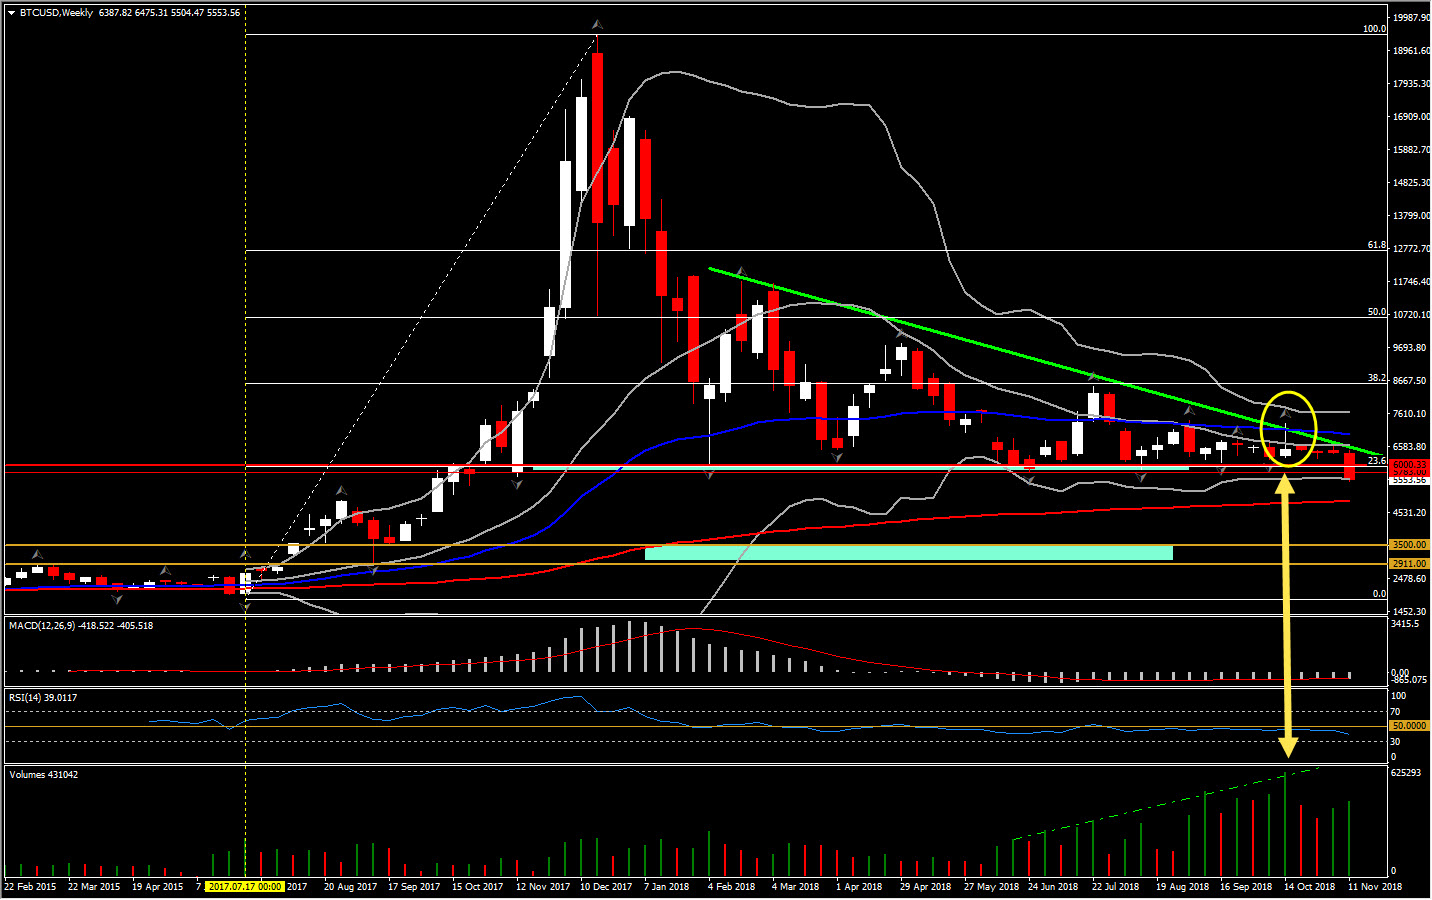
Hence, the focus turns on Bitcoin again, not exclusively on the break of year’s support but on the spike seen in volume as well. Interestingly, the largest volume spike was in the mid of October, which showed a lot of buying pressure (retest of $7,330 barrier), which, overwhelmed by bears, pushed the price to $184 above the opening at $6,300. The volume has been rising since June 2018 as price has been falling. This indicates that sellers require decreasing numbers and increasing enthusiasm in order to keep pushing prices lower. Theoretically, a price drop on large volume is a stronger signal that something in the stock has fundamentally changed. Hence this could suggest that the price might fall further.
From the technical perspective, the asset moved below the descending triangle established in 2018, which is considered to be a bearish sign for the asset. Meanwhile, daily momentum indicators reached oversold area, suggesting that the bearish rally reached an end. However weekly momentum indicators are bearish and point to more weakness in the near future. The weekly RSI is sloping negatively below neutral zone, whilst MACD confirmed a bearish cross with the signal line. These suggest the increase of bearish sentiment, with the next Support at $3,500-$2,911.00 (at 150-day SMA and October 2017 low). In the near term, Support is set at 200-week EMA, $4,867.90.
Oppositely, a rebound from this area along with the break of immediate Resistance between $6,000-$6,200, could drive the price towards the 20-week SMA of $6,625, or if higher than that the 3-month Resistance at $6,800.
Click here to access the HotForex Economic Calendar
Andria Pichidi
Market Analyst
HotForex
Disclaimer: This material is provided as a general marketing communication for information purposes only and does not constitute an independent investment research. Nothing in this communication contains, or should be considered as containing, an investment advice or an investment recommendation or a solicitation for the purpose of buying or selling of any financial instrument. All information provided is gathered from reputable sources and any information containing an indication of past performance is not a guarantee or reliable indicator of future performance. Users acknowledge that any investment in FX and CFDs products is characterized by a certain degree of uncertainty and that any investment of this nature involves a high level of risk for which the users are solely responsible and liable. We assume no liability for any loss arising from any investment made based on the information provided in this communication. This communication must not be reproduced or further distributed without our prior written permission.


