NZDCAD,H4 and Daily
The CAD has remained under pressure as WTI crude prices remain near 9-month lows, bottoming earlier at $58.26. NZDCAD’s rise to 0.89 area has been attributed to the dip in crude prices.
USOil prices are down 2.2% at $58.62. This is now the 12th consecutive down day in what is now the biggest 2-month back-to-back decline since late 2014 and early 2015. The latest nudge lower was provided by President Trump, who chastised in Twitter Saudi Arabia’s announcement yesterday that it will be trimming production by 500k barrels per day in December. WTI prices had reached a high of $61.28 yesterday on the back of the Saudi news.
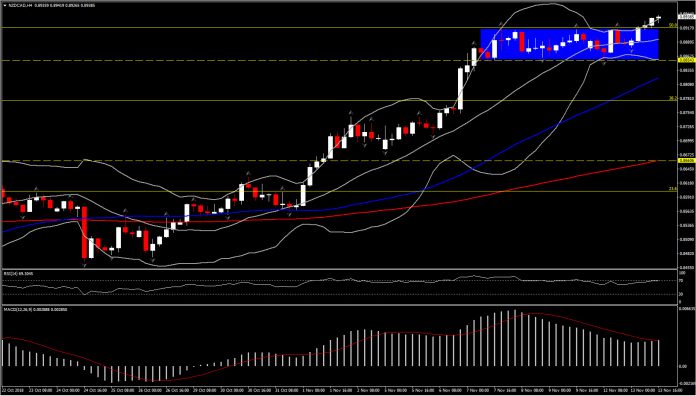
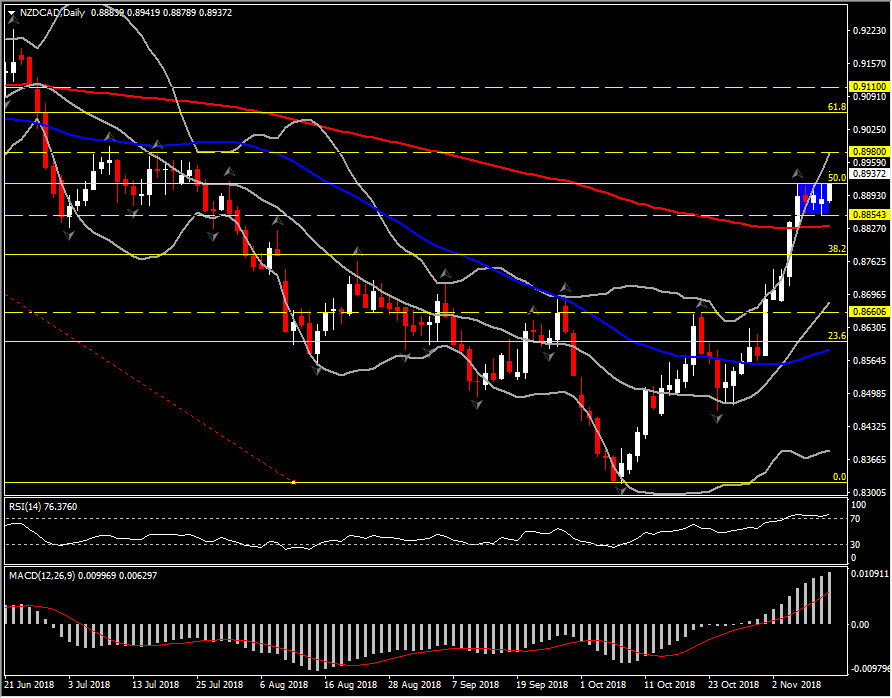
This dragged the CAD lower, with NZDCAD printing a new 4-month high at 0.8941, after rejecting 4 consecutive days’ Resistance at 0.8917. The pair confirmed a floor at 0.8830-0.8855 (200-day SMA and 3-day Support). This was followed by 2 extremely strong bullish weekly candles, which boosted the pair way above 200-month SMA and 20-week SMA, suggesting that bulls remain in control of the pair.
Today’s performance above 0.8917 confirmed the break of the 50% Fibonacci retracement level set since year’s peak on March 11. Meanwhile, the momentum indicators suggest that there is further steam to the upside in the near and medium term. Daily RSI crossed 70 barrier earlier, while on the weekly basis it is pushing above 50. Daily MACD lines are extending to the upside well above signal line, while weekly MACD lines formed a bullish crossover.
Therefore, as the technical picture looks bullish, the next immediate Resistance holds at July’s high at 0.8980. Next Resistance comes at the 61.8% Fibonacci level at 0.9055.
Click here to access the HotForex Economic Calendar.
Andria Pichidi
Market Analyst
HotForex
Disclaimer: This material is provided as a general marketing communication for information purposes only and does not constitute an independent investment research. Nothing in this communication contains, or should be considered as containing, an investment advice or an investment recommendation or a solicitation for the purpose of buying or selling of any financial instrument. All information provided is gathered from reputable sources and any information containing an indication of past performance is not a guarantee or reliable indicator of future performance. Users acknowledge that any investment in FX and CFDs products is characterized by a certain degree of uncertainty and that any investment of this nature involves a high level of risk for which the users are solely responsible and liable. We assume no liability for any loss arising from any investment made based on the information provided in this communication. This communication must not be reproduced or further distributed without our prior written permission.


