AUDUSD and AUDJPY
A risk-on theme drove the higher beta currencies higher, such as the Dollar bloc and emerging market currencies, while weighing on the Yen and Dollar. This came on news that Trump and Xi came to a truce, with China agreeing to “reduce and remove” tariffs below 40% on imports of US vehicles, according to President Trump.
This sparked strong gains on Asian stock markets, with China leading the way. The SSE Iindex rose by over 2.5%. USA500 futures rose by more than 1.8% in the overnight session.
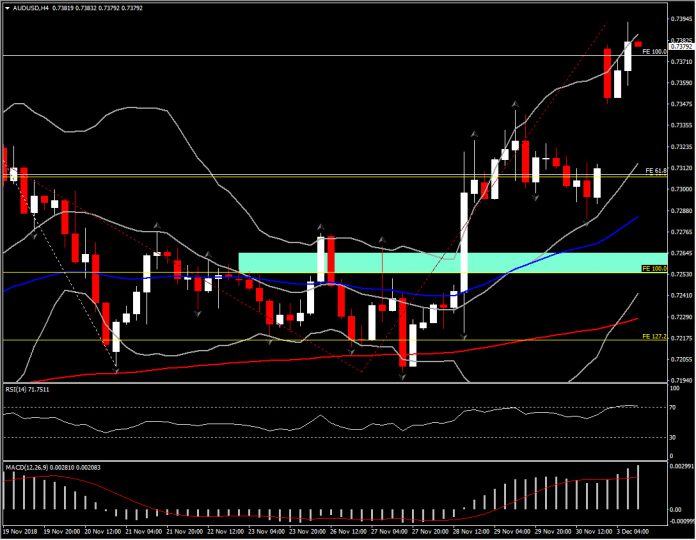
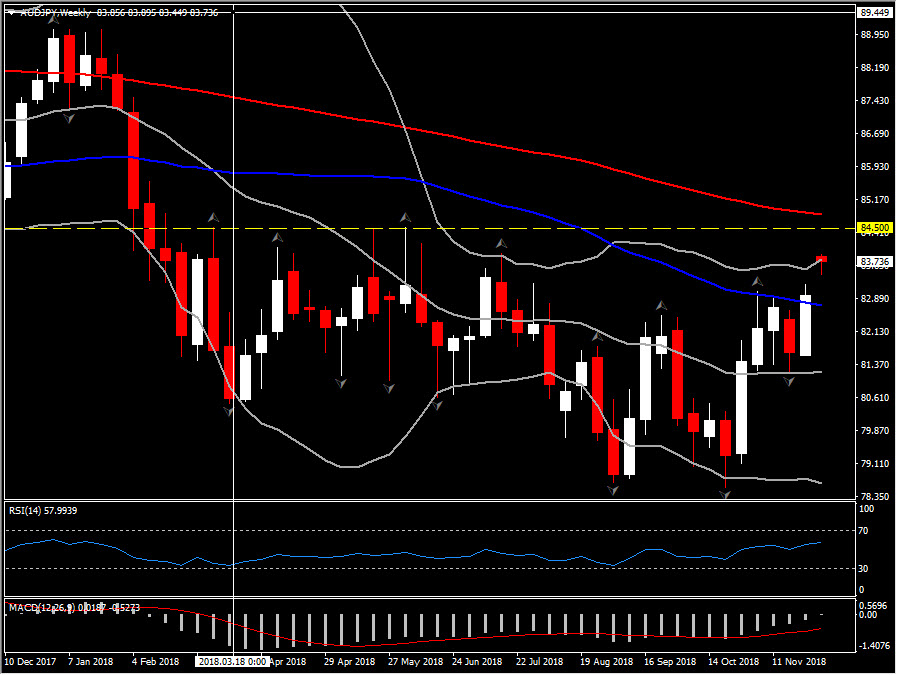
In the forex realm, the biggest movers out of the main Dollar pairings and associated cross rates have been AUDUSD and NZDUSD, which are both showing gains of 0.9%. AUDUSD posted a 4-month high at 0.7392, while the biggest incline has been seen in AUDJPY, which ascended into 4-month high territory, by 88 pips. The next strong Resistance for the asset is at 84.50, which coincides with a triple top formation between March-June 2018.
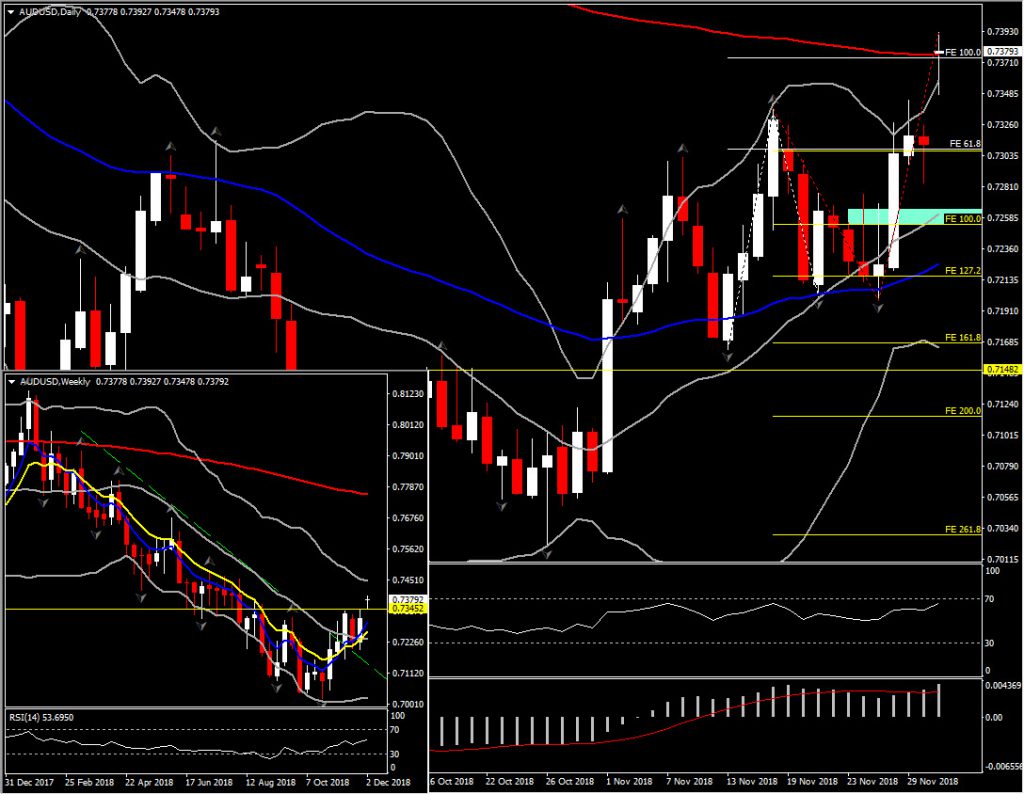
Meanwhile, AUDUSD confirmed on today’s opening the break of a key breakout, above the barrier that had been formed for 3 consecutive weeks, at 0.7345. This breakout level is significant as it is the confluence of the 3-month high, 200-day SMA and also the 100% Fib. extension level from the November 16 reversal. This spike suggests that bulls are trying to take control of the year’s sharp downtrend seen since January 29. A positive close today but tomorrow as well, which will keep the asset above today’s open at 0.7377 level, suggests that there is further steam to the upside, with the next Resistance levels to be at FE121.2, at 74.20, and the 74.80, which coincides with FE161.8 and July’s peak. The pair has immediate Support at the 0.7310 level and medium term Support at 0.7255-0.7260 area (20-day SMA and FE100.0)
Despite the fact that AUDUSD has ascended in recent weeks, it remains in an overall bearish outlook, as a downwards channel has been unfolding since late January from levels above 0.8100. Similarly, in the intraday chart, the formation of a tweezer top at the top of the hour, confirms the bearish momentum as well. The pair has Resistance at 0.7276(double top in the 4-hour chart), and Support at the 20-day SMA and day’s low at 0.7224.
The momentum indicators are also suggesting that bullish pressure is likely to continue growing as they are positively configured on a medium term basis and have also crossed overbought barrier in the intraday picture. Daily RSI is at 64 while MACD is increasing above signal line so far today.
Click here to access the HotForex Economic calendar
Andria Pichidi
Market Analyst
HotForex
Disclaimer: This material is provided as a general marketing communication for information purposes only and does not constitute an independent investment research. Nothing in this communication contains, or should be considered as containing, an investment advice or an investment recommendation or a solicitation for the purpose of buying or selling of any financial instrument. All information provided is gathered from reputable sources and any information containing an indication of past performance is not a guarantee or reliable indicator of future performance. Users acknowledge that any investment in FX and CFDs products is characterized by a certain degree of uncertainty and that any investment of this nature involves a high level of risk for which the users are solely responsible and liable. We assume no liability for any loss arising from any investment made based on the information provided in this communication. This communication must not be reproduced or further distributed without our prior written permission.


