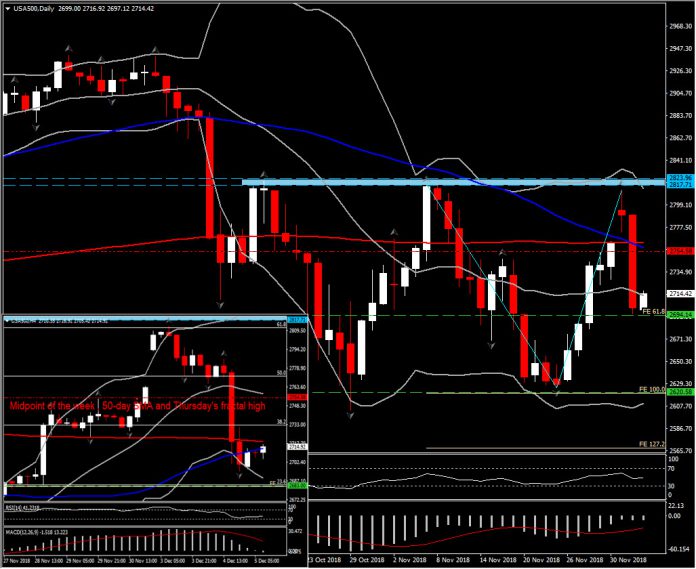
USA500, H4 and Daily
Global slowdown, tariff uncertainty, lower oil, Fed dovishness and yield curve inversion certainly all compounded the allocation out of stocks into bonds ahead of the closure of markets yesterday. The drop in yields and the inversion in the 3s-5s spread seems to have been the major catalysts for Wall Street’s better than 3% plunge, the action became circular with further weakness in stocks increasing demand for Treasuries.
Meanwhile, the trade developments remain in focus after already underpinning the sharp swings in markets over the first 2 days of the week, along with an ongoing recalibration of Fed policy expectations , where markets are now discounting a pause in the cycle, following a hike this month.
Hence, worries over curve inversion and the potential recessionary signal weighed on Equity market where trade concerns have resurfaced, shove the USA500 to a 2,695 low after tumbling through its 50- and 200-day SMA.
Despite the 0.4% gain noticed so far today, after the 3.2% loss yesterday, the index remains in a neutral to bearish outlook, with the formation of a Death Cross supporting the resurgence of the negative momentum in the near future.
Currently, the asset holds a floor at yesterday’s low at 2,695, which provides Support to the pair, as it also represents the confluence of 61.8% Fib. retracement level and the 61.8% Fib. extension from the rebound seen since November 26. Therefore, a break within the day, of this level, could drift the price to the next important area, at 2,620-2,630 area (FE 100 set since November 8 reversal, and the 5 consecutive low during 20-26 November).
Oppositely, in the 4-hour chart, the next intraday Resistance barrier holds at 2,754.50, which coincides with 20-period SMA, Thursday’s peak and also 50-day SMA. On a break of it, we could see the USA500 being boosted to 2-month upwards hurdle, at the 2,817.70-2824.00 area. As stated also in November, this area is a strong obstacle for the asset as is was retested 6 times so far and that renders it into a strong resistance area.
The daily momentum indicators are giving us a mix signal, however in the intraday chart, they present an increase of the negative momentum in the near future. RSI has flatted at 40 level suggesting consolidation of the USA500. MACD lines crossed into the negative territory, supporting that downside momentum has advanced.
Nevertheless, the US markets and the government are closed for a day of mourning for former President Bush. Hence markets are expected to remain thinned.
Click here to access the HotForex Economic calendar
Andria Pichidi
Market Analyst
HotForex
Disclaimer: This material is provided as a general marketing communication for information purposes only and does not constitute an independent investment research. Nothing in this communication contains, or should be considered as containing, an investment advice or an investment recommendation or a solicitation for the purpose of buying or selling of any financial instrument. All information provided is gathered from reputable sources and any information containing an indication of past performance is not a guarantee or reliable indicator of future performance. Users acknowledge that any investment in FX and CFDs products is characterized by a certain degree of uncertainty and that any investment of this nature involves a high level of risk for which the users are solely responsible and liable. We assume no liability for any loss arising from any investment made based on the information provided in this communication. This communication must not be reproduced or further distributed without our prior written permission.


