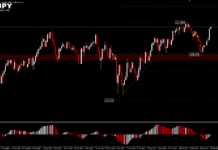
AUDJPY and USDJPY
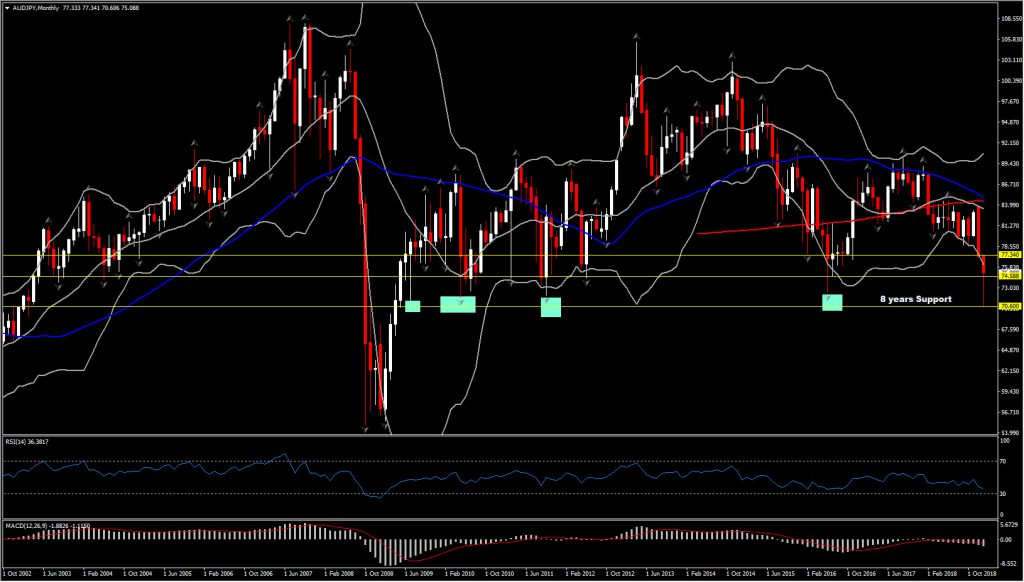
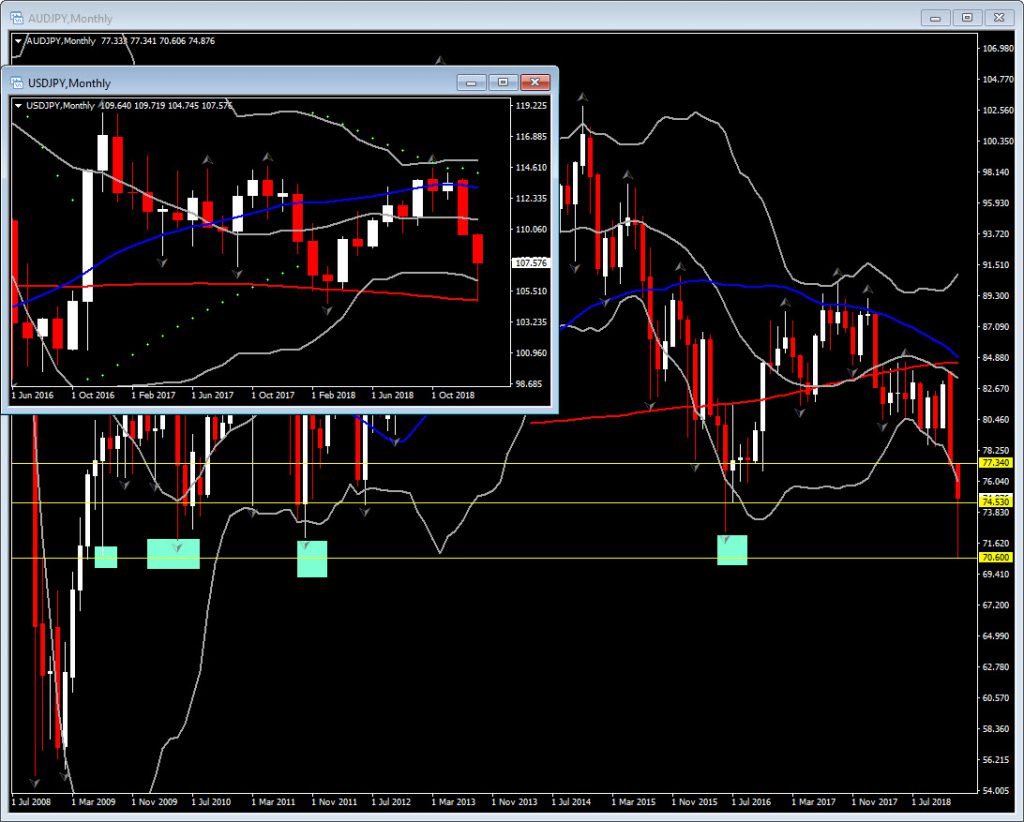
The Yen has strengthened sharply, driven by safe haven demand following Apple’s after-hours revenue warning, which has sent US equity futures down sharply while weighing on Asian markets. AUDJPY has been the biggest mover, and is showing a 1.8% loss despite having lifted out of its lows. With today’s sharp decline, Aussie fell apart dramatically at 70.60, its low area first established in 2009 which has been well retained since then with just 3 retests throughout the past 9 years, as shown below. AUDUSD recouped to levels around 0.6950 after printing a low at 0.6732, which is the lowest the pair has been since March 2009.
AUDJPY, and generally all the Australian Dollar crosses, climbed back, close to their day’s open prices. AUDJPY is currently trading above 0.7500 level from 0.7000 barrier.
The overall weakness of Aussie does not seem to have faded yet, proven by strong bear candles keeping the asset lower for the 5th week in a row. Momentum indicators are decisively negatively configured, showing that there is further steam to the downside, with the MACD, RSI and Stochastics continuing to accelerate lower. RSI and Stochastics are set at around 20, while MACD lines are extending lower, suggesting strong selling pressure.
As bearish outlook remains, immediate Support persists at July 2016 low, at 74.53, while the next levels to be watched are the round 72.00 and 70.60. The positive reaction on London open is not sufficient to raise hopes to the upside again.
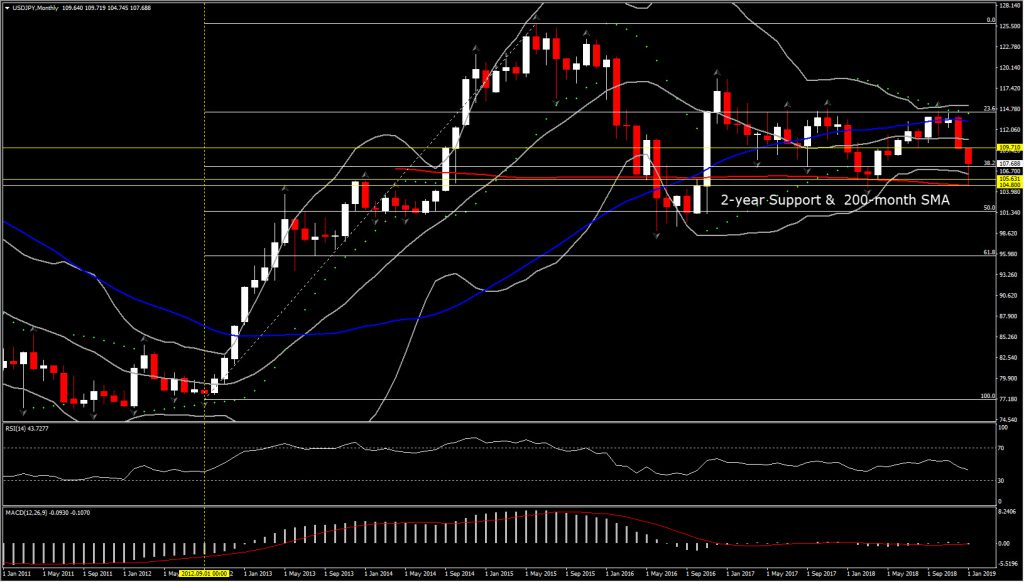
Australian Dollar losses have prompted the Yen rally against Greenback to the highest level since March. USDJPY is off by 1.4%, at 107.72, having printed a 10-month low at 104.81. The low was also seen during the early Asia-Pacific session, in thin markets in the continued absence of the Tokyo interbank market.
Today’s bottom also coincides with 200-month SMA and over 2-year Support, which renders it a strong area. Even though USDJPY has jumped higher by nearly 300 pips in the past 4 hours, strong negative bias weighs on the pair’s outlook, on the back of the risk-off dynamic.
In the daily timeframe, the market is not fully oversold, with momentum indicators suggesting that bearish momentum is increasing at least in the near term. Hence immediate near term Resistance is set at May 2018 low, at 108.10, while Support of the day is set at 106.79 as shown below. A break of the latter will add further selling pressure towards 105.63 (February & April 2018 low area) and 104.80 (day’s low, 200-month SMA and 2 year’s Support).
Click here to access the HotForex Economic calendar.
Andria Pichidi
Market Analyst
HotForex
Disclaimer: This material is provided as a general marketing communication for information purposes only and does not constitute an independent investment research. Nothing in this communication contains, or should be considered as containing, an investment advice or an investment recommendation or a solicitation for the purpose of buying or selling of any financial instrument. All information provided is gathered from reputable sources and any information containing an indication of past performance is not a guarantee or reliable indicator of future performance. Users acknowledge that any investment in FX and CFDs products is characterized by a certain degree of uncertainty and that any investment of this nature involves a high level of risk for which the users are solely responsible and liable. We assume no liability for any loss arising from any investment made based on the information provided in this communication. This communication must not be reproduced or further distributed without our prior written permission.


