The Case-Shiller Home Price Index (HPI) came out at 4.7% in November, compared to expectations of 5%, the same as October, providing an additional sign of the potential weakness in the US economy. Despite the drop in prices, other housing indices appear to continue their growth as building permits, housing starts, and existing home sales recorded higher volumes in November, even though the latter declined in December. Naturally, the fact that during the government shutdown there were no data releases did not help to clear the picture as regards to where the housing sector is headed.
The above developments are brought forward during a period when rejection rates among loan applicants are increasing, as lower demand for lending appears to be coupled with the banks’ unwillingness to increase lending. As a recent survey by the New York Fed shows, approximately 48% of the survey participants applied for any type of credit, with approximately 20% of the applicants being rejected by the banks. For the same period of last year applicants stood at 49%, while the rejection rate was 15.7%. The decline in credit demand in the October 2018 survey, compared to the same period last year, indicates that the private sector does not appear to be willing to obtain extra liquidity, supporting the theme of our previous analyses on the US short-term debt cycle. Interestingly, this occurs despite the banks suggesting that lending standards have been relaxed.
This has important implications for the housing sector: as more consumers shun off debt, the pool of people willing to purchase houses decreases. This is more important for the millennial generation as they still have to pay back high levels of student debt and need to find money for a down payment, which keeps on increasing as house prices rise.
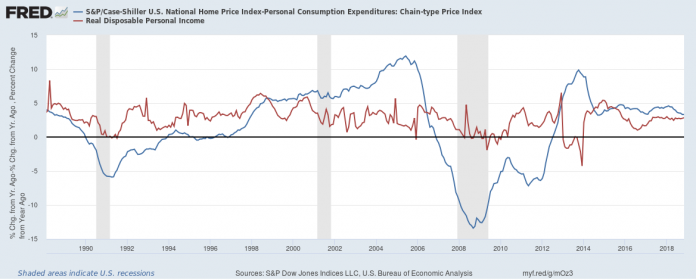
The major problem in the US housing market is that real house prices (house prices minus PCE inflation) appear to be increasing by more than real income. As the graph at the top of this article indicates, the misalignment between real income (red line) and real house price growth (blue line) is more pronounced in recent years, with real house prices recording an average increase of 3.87% since 2015, compared to just 2.8% for real income. This observation is far from the norm: once the full history of the series is taken into consideration, real house prices grow at an average of 1.6% annually compared to 2.7% for real income. The result is similar regardless of the measure of income.
Despite house prices being much less volatile since mid 2014, the fact is that the positive spread between their growth and income cannot be maintained forever. The apparent slowdown in housing prices is inevitable if sustainable growth is to be expected in the sector. In fact, we should not be surprised to see much lower growth rates over 2019, as prices will inevitably have to adjust, regardless of whether sales or building permits remain at the same levels or not.
Click here to access the Economic Calendar
Dr Nektarios Michail
Market Analyst
Disclaimer: This material is provided as a general marketing communication for information purposes only and does not constitute an independent investment research. Nothing in this communication contains, or should be considered as containing, an investment advice or an investment recommendation or a solicitation for the purpose of buying or selling of any financial instrument. All information provided is gathered from reputable sources and any information containing an indication of past performance is not a guarantee or reliable indicator of future performance. Users acknowledge that any investment in FX and CFDs products is characterized by a certain degree of uncertainty and that any investment of this nature involves a high level of risk for which the users are solely responsible and liable. We assume no liability for any loss arising from any investment made based on the information provided in this communication. This communication must not be reproduced or further distributed without our prior written permission.


