


WTI crude got a boost from the strong US Jobs report, which was accompanied by several other upbeat reports. The jobs report has alleviated some of the concerns that the economy may be slowing, which has helped the demand side of the oil equation. Signs of progress on US-Sino trade talks have provided some support as well.
A lack of domestic data and events has kept the focus on the US, with GoC’s keying off Treasuries as yields moved sharply higher. USDCAD has remained downwardly mobile, with the Canadian Dollar benefitting from recent strong gains in oil prices .This comes with Oil prices contract rallying to $55.90 highs, having rallied by nearly 7% over the last week, extending the year-to-date advance to over 22%. This is a boon to Canada’s terms of trade.
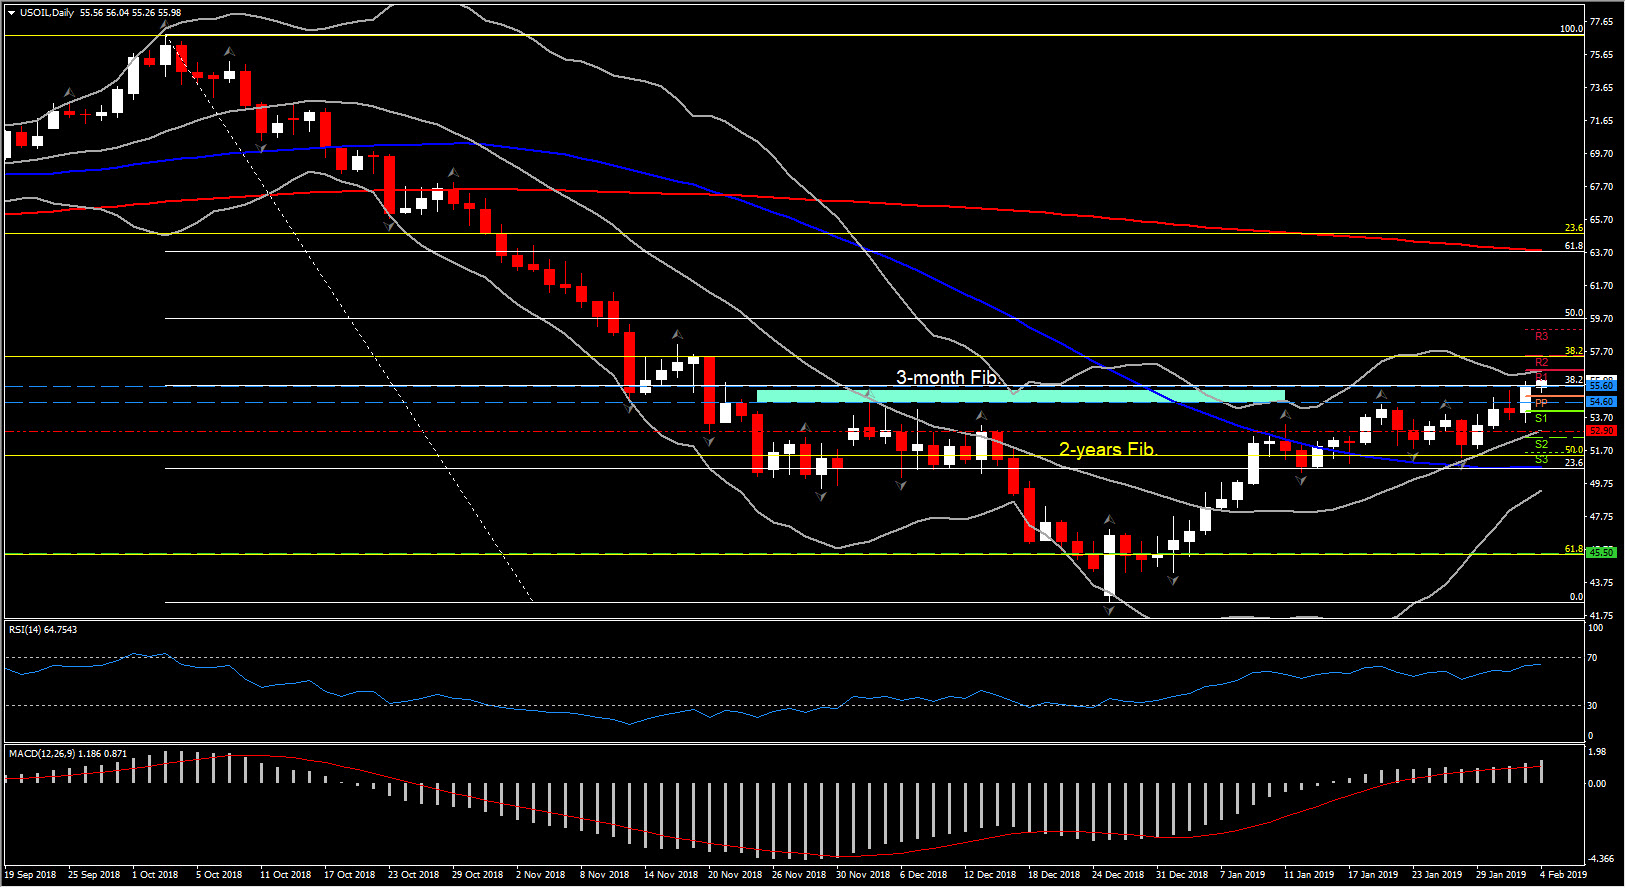
Oil keeps Friday’s gains as it is currently trading at $55.70 after rejecting the strong Resistance area at $54.55-$55.60, as we proposed early January.
Even if in the bigger picture the market continues to hold in bearish tendency, a decisive close above the latter ($52.00) could boost Oil towards $54.55-$55.60 area.
In conclusion, oil futures currently continue to have with an overall bearish outlook, while in the short term it is in a bullish mode, with indications for a possible reversal on the 3-month decline.
The decisive positive candle on Friday reflects the rejection of December’s peak but significantly, a 38.2% reversal of the losses seen in the last Quarter of 2018, from a nearly $77.00 high. If the asset sustains its action above this barrier, then the 38.2% Fib, level at $55.60 could turn into a Support level for USOIL, while at the same time it opens the doors towards $59.00-$59.50 area (50% Fib. level).
In the short term, the next immediate Resistance level for USOIL is at $58.00, which coincides with R2 from day’s PP analysis but importantly with the 38.2% Fib. retracement level (in yellow on the chart) of the upleg from 2015 lows to the 4-year highs at $76.90. Immediate Support holds at the 20-day SMA , at $52.90.
According to the momentum indicators, there is still a lot of positive bias to USOIL in the near term. In the daily timeframe, RSI slopes positively towards 70, and MACD lines captured higher above neutral and signal line.
It is still worth being careful, despite the week having opened with lots of positive vibes, as in the bigger picture the asset remains below the 20-week SMA.
Click here to access the Economic Calendar
Andria Pichidi
Market Analyst
Disclaimer: This material is provided as a general marketing communication for information purposes only and does not constitute an independent investment research. Nothing in this communication contains, or should be considered as containing, an investment advice or an investment recommendation or a solicitation for the purpose of buying or selling of any financial instrument. All information provided is gathered from reputable sources and any information containing an indication of past performance is not a guarantee or reliable indicator of future performance. Users acknowledge that any investment in FX and CFDs products is characterized by a certain degree of uncertainty and that any investment of this nature involves a high level of risk for which the users are solely responsible and liable. We assume no liability for any loss arising from any investment made based on the information provided in this communication. This communication must not be reproduced or further distributed without our prior written permission.


