


The new week kicks off with the Dollar on the front foot on the back of impressive US July jobs figures from Friday.
Dollar
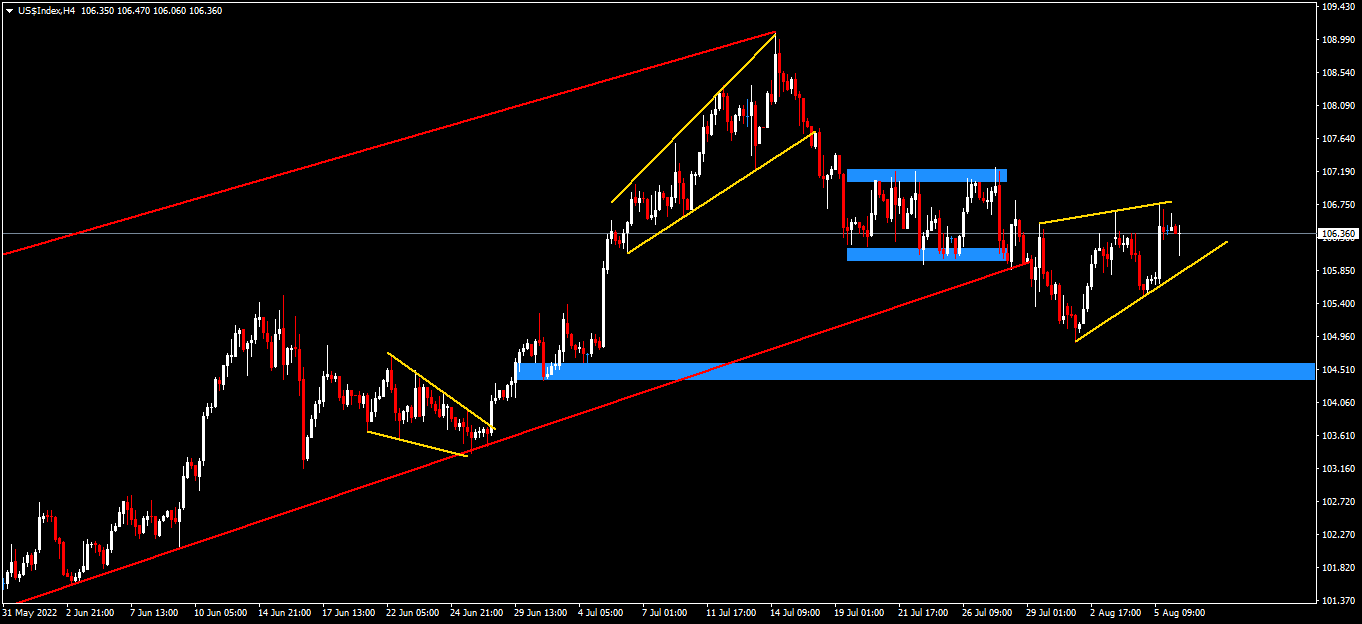
Stronger than expected July jobs figures from Friday’s NFP have buoyed the Dollar significantly and the Index continues to trade near multi-session highs around the 106.36 area at the time of writing. A key economic event this week in the form of July CPI data could potentially be the catalyst for a sustained run towards the upper end of the range around the 108.90 area and may influence the monetary stance of the FED going into September where a 75bps rate hike is increasingly becoming more of a probability.
Technical Analysis (H4)
In terms of market structure, price moved impulsively from the bear flag continuation pattern, towards the 104.96 area, before moving back up again correctively to retest the lows of the broken bear flag. What we see now is price potentially creating another bearish continuation pattern in the form of a rising wedge, which has the potential to yield a subsequent impulsive wave that would put the bears in control to challenge the 104.51 area. Conversely, if the pattern fails to break below the 104.96 area, then we could see the bulls take control and drive price towards the 108.00 area.
Euro
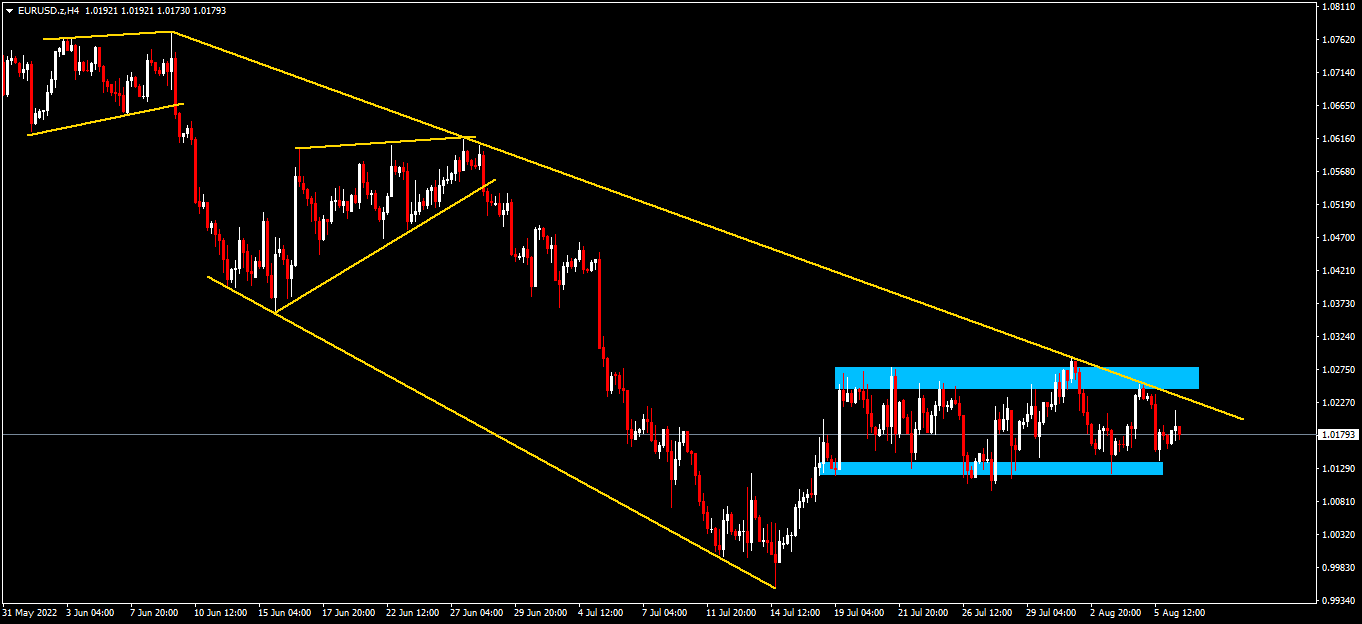
The Euro began this week trading at the lower end of the range it’s been locked in for the past three weeks between the 1.0132–1.0287 area. Volatility from the creation of additional jobs in the US economy in July was the catalyst for the move from the high towards the low end of the range. Market commentators are making the argument for an upside scenario out of this range as well as a downside scenario. The downside is influenced mainly by inflationary pressure and recession fears as well as geopolitical tensions between Europe and Russia. The upside scenario is mainly driven by investors already having priced in the above factors which supports the argument for the pair hitting the 1.0287 area since touching parity levels.
 Technical Analysis (H4)
In terms of market structure, price is still locked in the potential bullish continuation pattern (Bull Flag) that we identified last week. An impulsive break above the structure at the 1.02786 area would be the catalyst for the confirmation of this pattern and put buyers in the driving seat to challenge the 1.04518 area. On the flipside, if the above-mentioned scenario fails, price could potentially revisit areas below the 1.0129 level.
Pound
Sterling kicked off the week trading up at 0.4%, clawing back some of the gains it lost in the latter half of Friday’s trading session. Going into the first half of the week though, investors will be cautious as US inflation data is poised to be released on Wednesday, and that will give a guide in relation to the health of the world’s strongest economy against the Pound and other peers. Nevertheless, economists are still pointing towards a more fragile Pound in Q3 as the Dollar remains strong, combined with the historic data that shows how poorly the Pound performs when global financial conditions tighten.

Technical Analysis (H4)
In terms of market structure, current price action is moving correctively towards the 1.19990 area in the form of a potential bullish continuation pattern (Descending Channel). The overall picture is drawing out a potential inverse head and shoulder pattern which has the potential to turn into a bullish reversal pattern at these areas. If confirmed we could see the bulls drive price towards the 1.24115 area, and on the flipside if price breaks below the 1.19480 area, we could see the bears take control and move price to challenge the lows around the 1.18970 area.
Gold
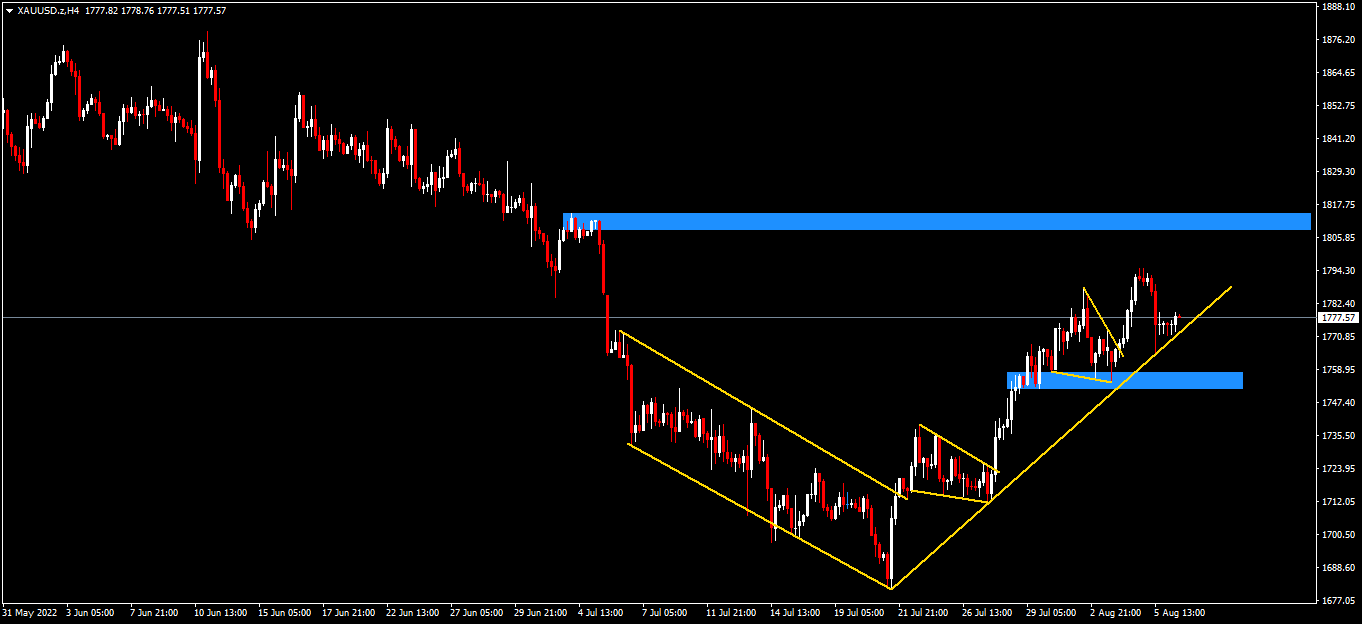
As the dust begins to settle from Friday’s NFP data, the new week is pivotal for the yellow metal as Inflation data for July comes firmly into sight this Wednesday and may be the catalyst for a potential downward move in the price. While the FED remains data-dependent for its policy outlook, Gold will remain at the mercy of US employment figures and a risk-on sentiment driven by the perception of a strong economy and the potential for increased aggression from the FED.
Technical Analysis (H4)
In terms of market structure, price has been moving in an uptrend, creating higher highs, and higher lows. Having exited the bullish continuation pattern (Falling Wedge) formed last week, price printed out an impulsive wave and pulled back to find support on the lower trendline of the channel. Henceforth price could continue its trajectory to hit the $1,810 area, or on the flipside sellers could take control of the market if price falls below the support around the $1,750 area.
Click here to access our Economic Calendar
Ofentse Waisi
Market Analyst
Disclaimer: This material is provided as a general marketing communication for information purposes only and does not constitute an independent investment research. Nothing in this communication contains, or should be considered as containing, an investment advice or an investment recommendation or a solicitation for the purpose of buying or selling of any financial instrument. All information provided is gathered from reputable sources and any information containing an indication of past performance is not a guarantee or reliable indicator of future performance. Users acknowledge that any investment in Leveraged Products is characterized by a certain degree of uncertainty and that any investment of this nature involves a high level of risk for which the users are solely responsible and liable. We assume no liability for any loss arising from any investment made based on the information provided in this communication. This communication must not be reproduced or further distributed without our prior written permission.


