


Stocks rose last week despite the uncertainty in Washington. The Nasdaq Composite climbed 3.04% to an 11-month high, while the S&P 500 gained 1.65% and the Dow added 0.38%.
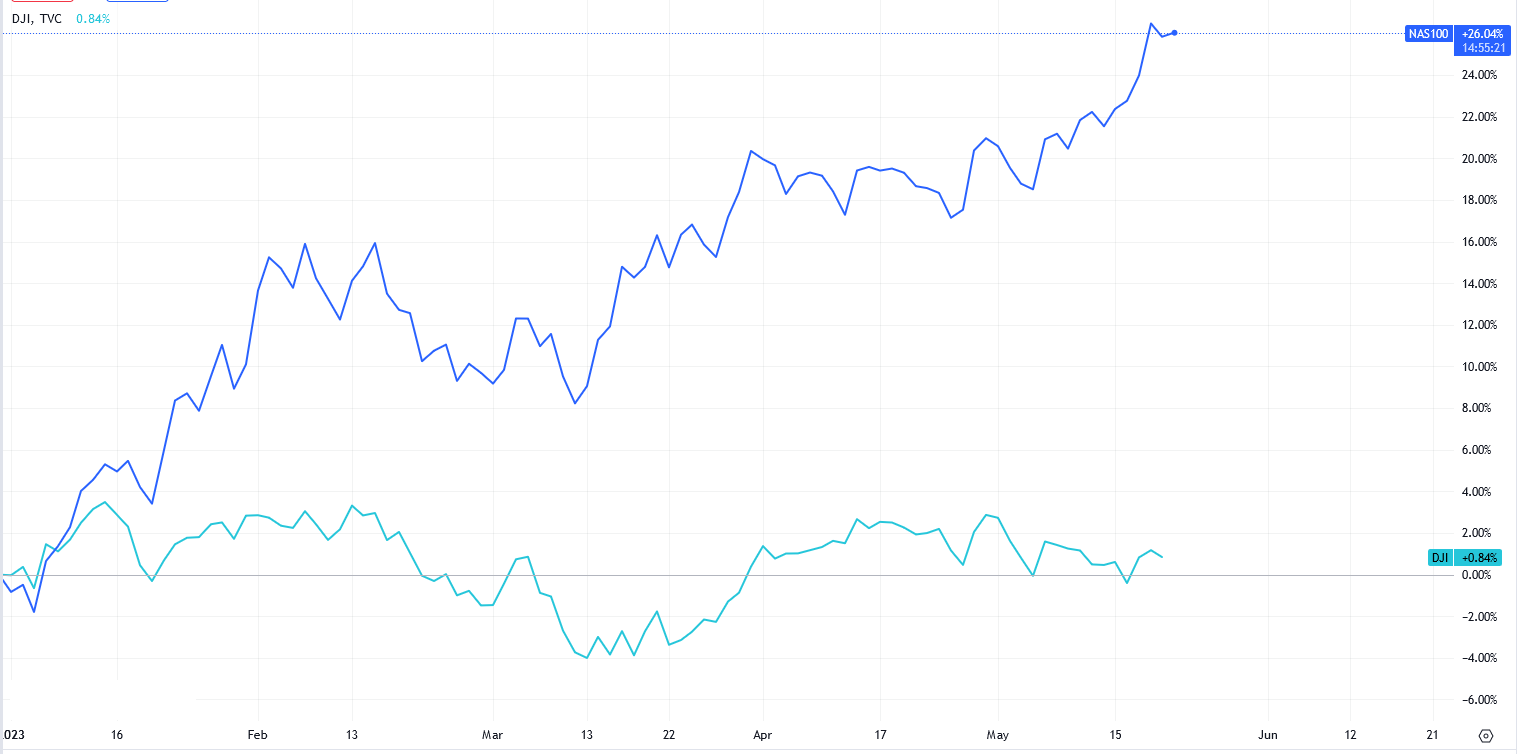
There are a number of interesting themes, such as the new clear divergence between ”value” and ”growth” with the technology index up 26% since the start of the year while the US30 is flat (+0.8%), and the fact that the most rate-sensitive index is performing better than its peers, following a worse performance in 2022.
US100 vs US30, Ytd
Today we will focus on the performance of some of the stocks that have the most weight (and also a considerable weight in the S&P 500 – about 24.8%) and others that have been among the best performers: we will take a quick look at their charts to see where they stand and what information we can get about the overall index.
| # | Company | Symbol | Weight |
|
PE | Fwd PE | |
| 1 | Microsoft Corp | MSFT | 13.25% |
|
34.51 | 29.14 | |
| 2 | Apple Inc | AAPL | 12.52% |
|
29.76 | 26.77 | |
| 3 | Amazon.com Inc | AMZN | 6.69% |
|
282.16 | 45.84 | |
| 4 | NVIDIA Corp | NVDA | 5.63% |
|
179.57 | 51.01 | |
| 5 | Alphabet Inc | GOOGL | 4.19% |
|
27.72 | 19.54 | |
| 6 | Alphabet Inc | GOOG | 4.13% |
|
27.72 | 19.54 | |
| 7 | Meta Platforms Inc | META | 3.98% |
|
29.48 | 16.88% | |
| TOT | 50.39% |
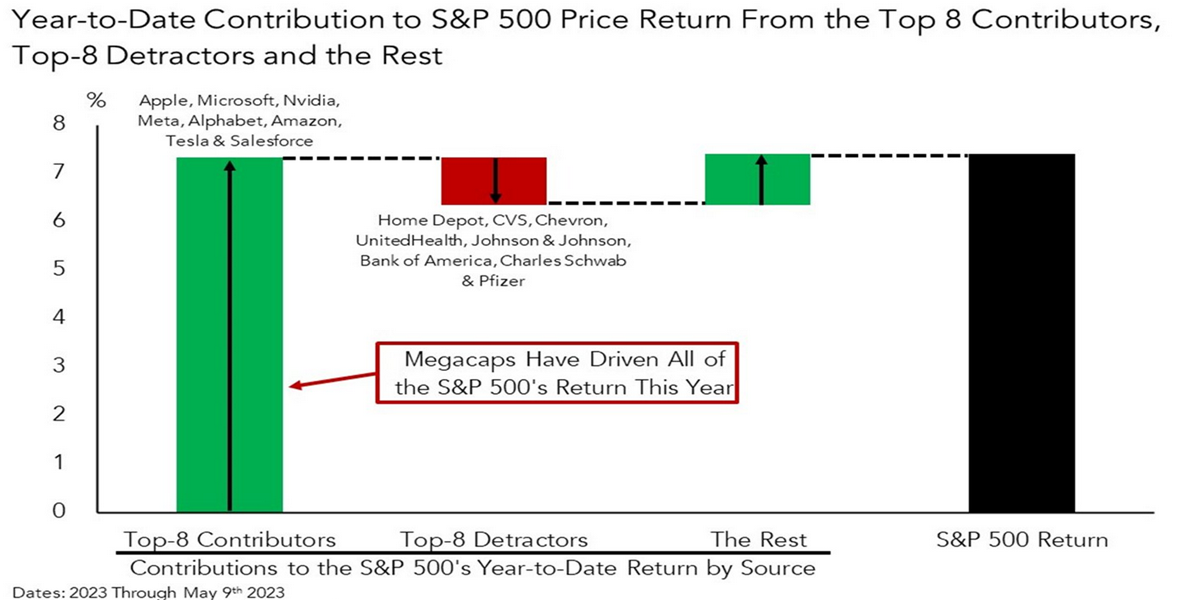
After all, it is no mystery that much of the good performance of not only the US100 but also the US500 has been driven by these mega names, while smaller companies have struggled (less visibility among investors and probably also tougher financing conditions in the new rate hike cycle with higher rates).
Contribution to the overall US500 Price Return
The below individual stocks have a significant weight in the index, and there are several interesting points to note: these big names had already broken important resistances weeks ago, clearly showing that the former bear market was almost moribund; quarterly year-on-year EPS growth has stagnated for all the below, but those that are trading close to historically high prices have managed to keep yearly trailing EPS at rather high levels (thus justifying higher prices and the complete pullback from the previous drop); finally momentum is certainly very strong for all the stocks considered, but important resistance levels are being approached (or in some cases are already there) while the indicators are high and in some cases overbought (although not extremely). To sum up, a further increase of stock prices -which have already gone up considerably- should be justified by better expected future fundamentals and probably cheaper ratios (that momentarily does not seem to be the basic case scenario). Keep this in mind when trading indices strongly influenced by some of these stocks.
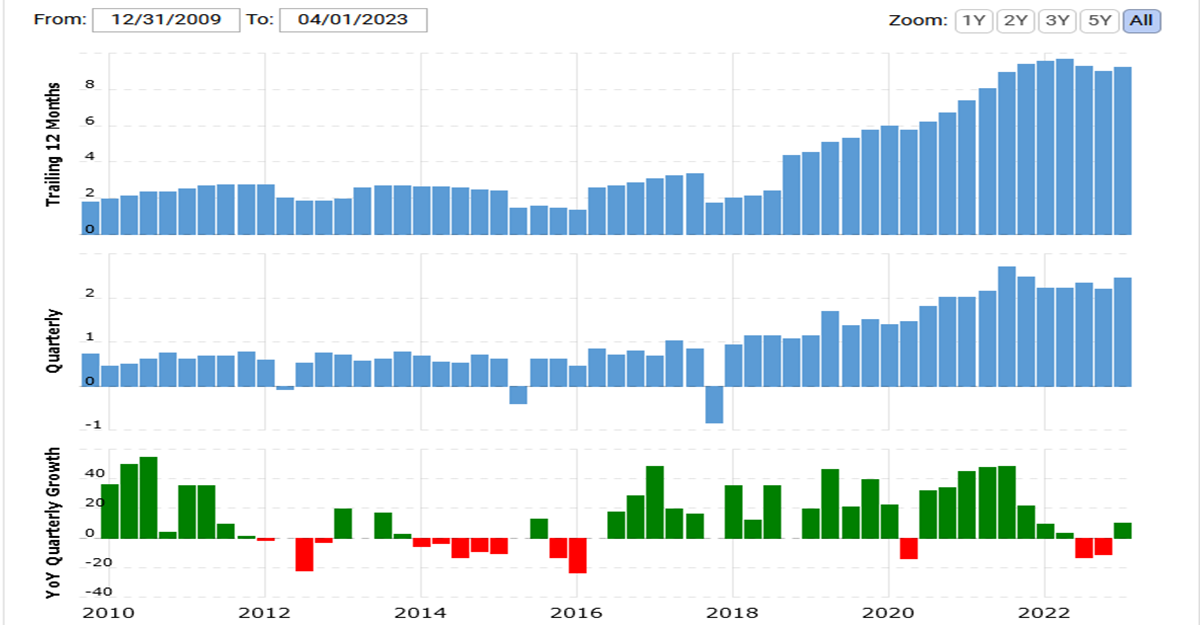
MICROSOFT
Cyclical lows: $212.63, 3rd Nov (+50.49%); EPS (31/03): $9.24, $9.65 in 2022, $8.05 in 2021; a slight slowdown from last year’s peaks and stagnant during the last few quarters. The bearish trendline/channel was broken between December 2022 and February 2023. MACD very positive, RSI in overbought zone at 71.71. Area $320 is resistance, next $330 (3.65%). Momentum is definitely strong, but we are not in the early innings of the game and there may still be a little upside room. $345 area is an All-Time High (ATH), about 8% higher than here.
MSFT, price and EPS evolution

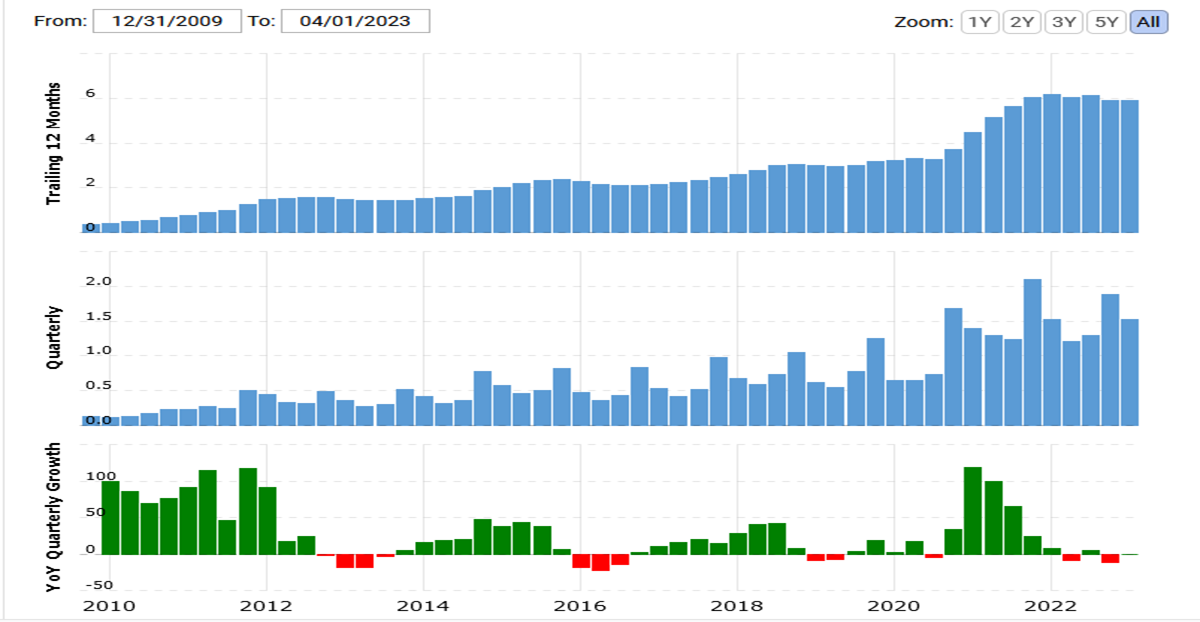
APPLE
Cyclical lows: $123.81, 3rd Jan (+40.45%); EPS (31/03): $5.89, $6.11 in 2022, $5.61 in 2021; a slight slowdown from last year’s peaks. The broad bearish channel seems to have been broken only recently, towards the end of April. The current level is resistance ($176), the $182.80 area is ATH (3.25% away). RSI at 67.5 still not overbought. There may still be room for consolidation at these levels. A break of the highs should be accompanied by an increase in future forecasts, including EPS (which seems to have stopped going up after 2021).
AAPL, price and EPS evolution

NVIDIA
Cyclical lows: $108.08, 3rd Oct (+189%); EPS (31/03): $1.74, $3.85 in 2022, $1.73 in 2021, a consistent decline since last year (-54.81%); Nvidia has clearly broken its 2022 downtrend at the beginning of this year and it’s showing an extremely strong momentum, with MACD positive and RSI close to overbought – but not yet. $346 is the ATH (10% away) while there’s still a resistance area between $323 and $333. Of the stocks we are monitoring, it is probably the one that is struggling the most with its EPS growth – in fact it is coming off four quarters of negative year-on-year growth.
NVDA, price and EPS evolution


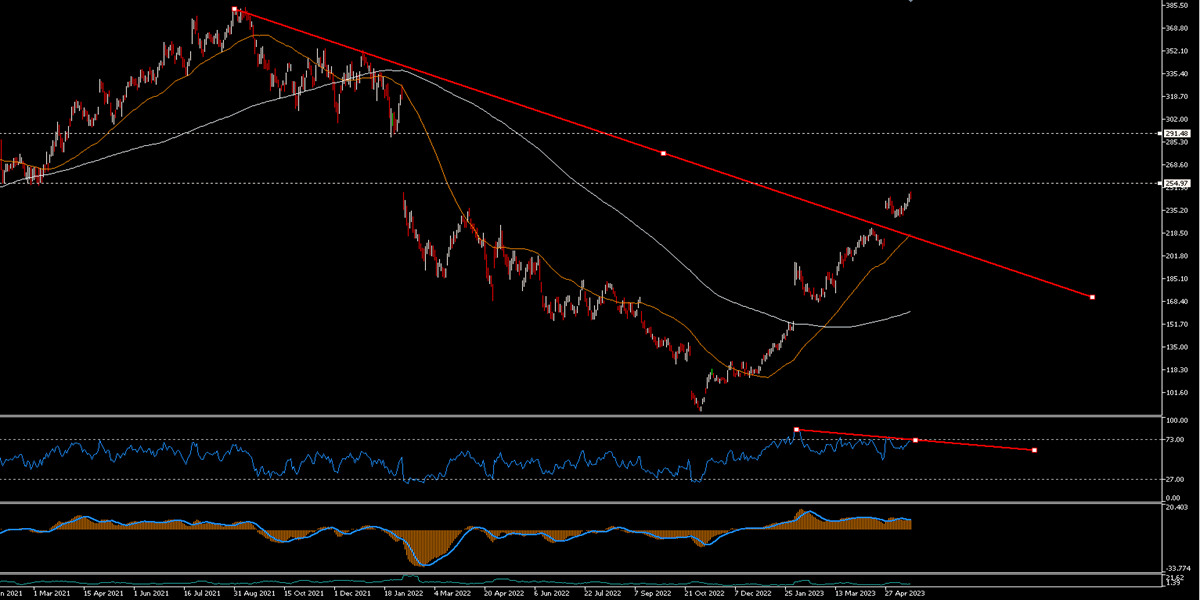
META
Cyclical lows: $88.09, 4th Nov (+178.85%); EPS (31/03): $8.07, $8.59 in 2022, $13.57 in 2021, showing a clear struggle during the last 5 Quarters despite the recent price spike. Meta is another stock that has JUST broken the downtrend and is in this case a long way from the all-time highs (a similar thing is happening with Amazon). The $250/$255 area is a strong resistance and a break through it could take it as high as 290$ (but this is still almost 20% away); the RSI is diverging.
META, price and EPS evolution

Click here to access our Economic Calendar
Marco Turatti
Market Analyst
Disclaimer: This material is provided as a general marketing communication for information purposes only and does not constitute an independent investment research. Nothing in this communication contains, or should be considered as containing, an investment advice or an investment recommendation or a solicitation for the purpose of buying or selling of any financial instrument. All information provided is gathered from reputable sources and any information containing an indication of past performance is not a guarantee or reliable indicator of future performance. Users acknowledge that any investment in Leveraged Products is characterized by a certain degree of uncertainty and that any investment of this nature involves a high level of risk for which the users are solely responsible and liable. We assume no liability for any loss arising from any investment made based on the information provided in this communication. This communication must not be reproduced or further distributed without our prior written permission.


