Gap, which has a market capitalization of $3.81B, is a famous American clothing retailer known for its focus on casual and fashionable clothing under its main brand (and other sub-brands such as Old Navy, Banana Republic, Athleta, etc). It was founded in 1969 in San Francisco, California, United States where it has most of its 3352 shops around the world. The company is expected to report its third quarter 2023 earnings on Thursday, 24/08/2023 after the market closes.
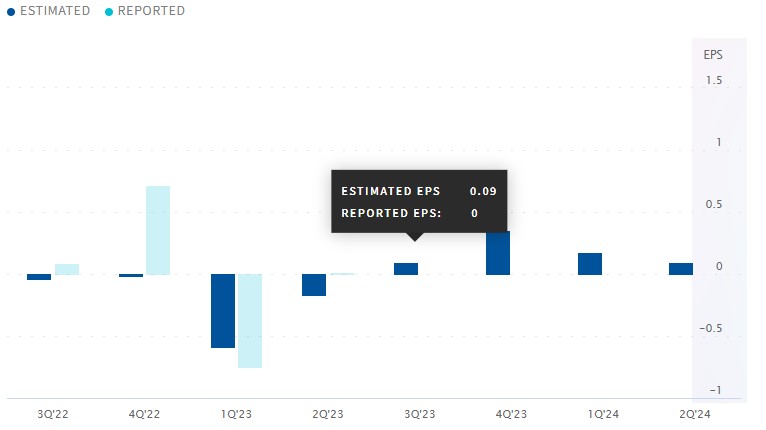
Zacks ranks Gap “Rank #3 – Hold” in the Top 37% of the Retail-Apparel & Footwear industry. For this report EPS is expected to be $0.09 (same for Nasdaq) which would be up 0.08% YoY from the $12.50 reported for the same period last year, this quarter it has 64.66% ESP
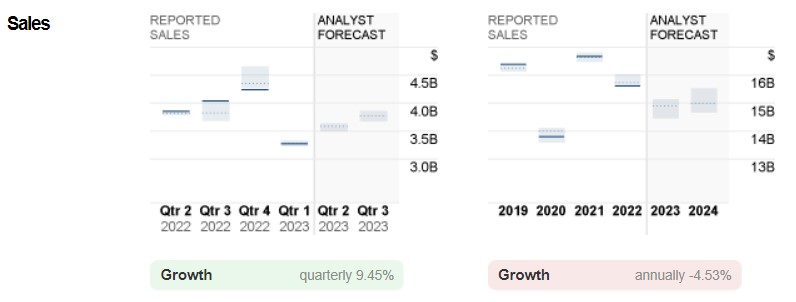
The Expected profit of $3.60B would be a -6.74% y/y growth from $3.86B last year. The company has a P/E ratio of 16.40 and a PEG ratio of 1.37. The estimate has had 1 upward and 2 downward revisions in the last 60 days.
The company has had mixed results in recent quarters, the last one with an EPS surprise of 105.88% but the last one negative with -27.12%.
Last quarter the company reported EPS of $0.01 and revenue of $3.3B.
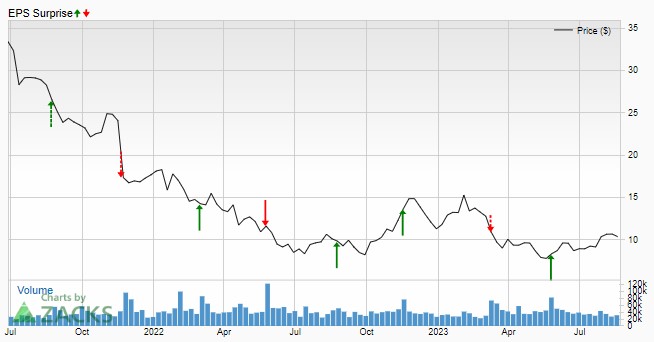
Regarding the GPS stock price forecast for the next 12 months, the lowest forecast is for a -41.6% decline at $6.00, the highest expectation a +75.2% increase at $18.00, while the average price is -2.7% at $10.00.
As Gap has been implementing aggressive cost management strategies, its performance in the reporting quarter is expected to have improved. Efforts to improve the calibre and speed of decision making included broadening the span of control and reducing management layers, as well as developing a uniform organisational structure across all four brands.
Improved margins are anticipated to benefit Gap’s performance in the second quarter of fiscal 2023, driven by increases in merchandise margins driven by decreases in air freight and promotions. Investing in cost-saving trading technology and reducing advertising spending are also positive signs.
Management anticipated that gross margin would increase year over year in the second quarter of FY2023 during the last reported quarterly earnings call.
Adjusted gross margin is expected to increase by 110 basis points (bps) YoY to 37% in the second quarter of the fiscal year, indicating a decrease in cost of sales caused by lower freight costs. Based on the company’s guidance, our model predicts that adjusted selling, general and administrative expenses (SG&A) (operating expenses) will decline 1.6% year over year to $1.3 billion in the second fiscal quarter.
In addition, the company is anticipated to benefit from the continued success of the Athleta brand. Sales have been helped by the active and lifestyle categories, which are supported by Athleta’s brand equity, increased investments in digital marketing and a focus on product strategy. Encouragingly, more attention is being paid to active lifestyle and active performance products to capitalise on changing consumer trends.
With the implementation of its Power Plan 2023, which focuses on opening highly successful Old Navy and Athleta shops and closing underperforming Gap and Banana Republic shops, Gap has been on the right track. According to the plan, by 2023, Old Navy and Athleta will account for approximately 70% of total sales.
But it is anticipated that Gap experienced flat demand and continued inflationary pressure during the reporting quarter. Gross margin growth in the second quarter of the fiscal year is expected to have been partially offset by inflationary headwinds.
Gap’s top line performance in the reporting quarter is also expected to have been impacted by the confusing macroeconomic and consumer environments. Spending by low-income consumers on non-essential items such as clothing is likely to have been hampered by rising commodity prices.
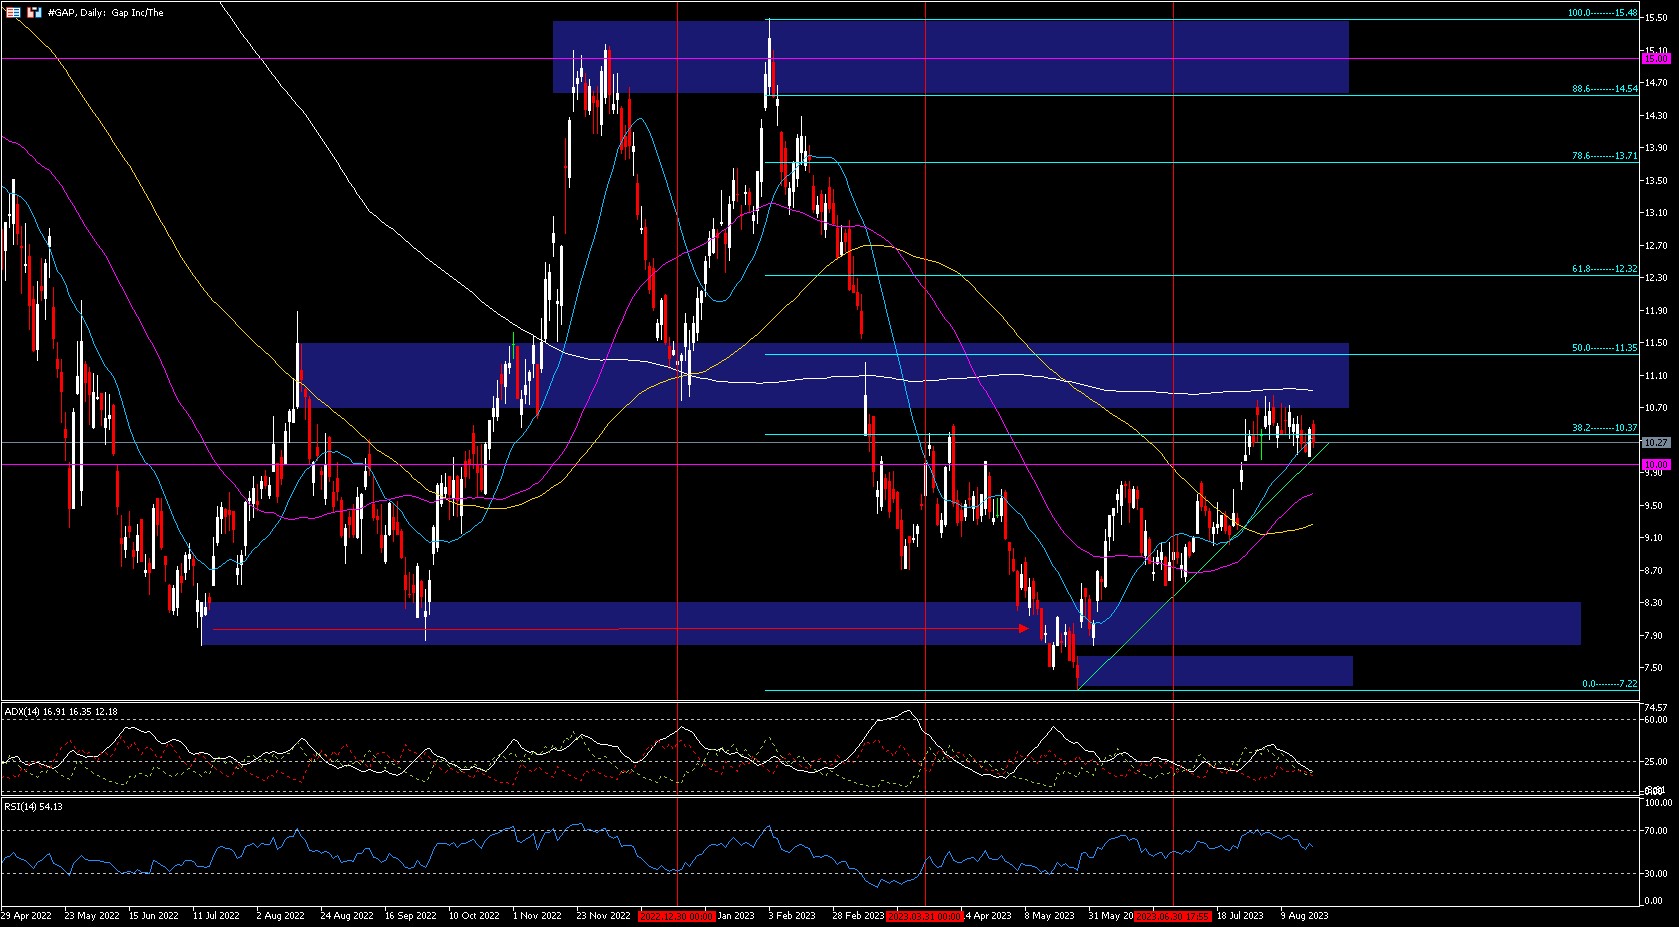
Technical Analysis – Gap D1 – $10.26
All time high: $53.75 (Feb 2000)
In the first quarter #GAP fell -43.77% from its highs with a double top at $14.54-$15.49 to a low of $8.71 but closed the quarter testing the psychological $10.00 level.
This second quarter the price fell again by -31.04% from the highs at $10.50 to leave lows at $7.22. These lows took liquidity from the September-July 2022 lows (but did not break the April 2020 lows at $5.26) and formed the head of a “reverse shoulder head shoulder” and closed the quarter with the right shoulder near the first quarter lows at $8.51, with the collarbone of the pattern at $9.86 already broken. The target of the pattern would be near $12.40 (61.8% Fibo at $12.32).
Once the collarbone was broken the price rallied during July to regain the psychological $10 level and made a high at $10.90 where it has remained within this range for 18 days pending its results.
Breaking the first quarter highs would break the bearish structure and for this it would have to first break and hold the first quarter lows at $10.82 along with the 50% Fibo $11.35, which would fit the pattern target.
ADX at 16.91 with no confirmed trend but with the +DI at 16.35 overcoming the -DI at 12.18. RSI at 54.13, neutral for the range. Daily 200 period SMA at $10.91 – 20 period SMA resisting bearish test. There was a Golden Cross on August 3rd.
Click here to access our Economic Calendar
Aldo Zapien
Market Analyst – Educational Office HFM Latam
Disclaimer: This material is provided as a general marketing communication for information purposes only and does not constitute an independent investment research. Nothing in this communication contains, or should be considered as containing, an investment advice or an investment recommendation or a solicitation for the purpose of buying or selling of any financial instrument. All information provided is gathered from reputable sources and any information containing an indication of past performance is not a guarantee or reliable indicator of future performance. Users acknowledge that any investment in Leveraged Products is characterized by a certain degree of uncertainty and that any investment of this nature involves a high level of risk for which the users are solely responsible and liable. We assume no liability for any loss arising from any investment made based on the information provided in this communication. This communication must not be reproduced or further distributed without our prior written permission.


