


The Walt Disney Co., a diversified international family entertainment and media enterprise founded since 1923, shall release its Q4 2023 earnings result on 8th November (Wednesday), after market close. The company operates via two main segments: Disney Media and Entertainment Distribution (DMED) and Disney Parks, Experiences and Products (DPEP). The former covers the company’s global film, television content production and distribution activities, while the latter encompasses parks and experiences and consumer products.
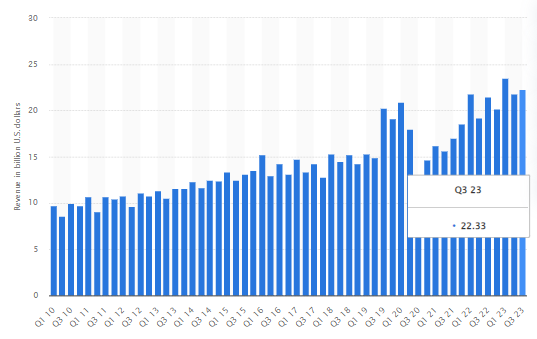
Walt Disney generated $22.3B revenue in Q3 2023, up 2.34% from the previous quarter, and up 3.86% from the same period last year. According to the official report, revenue generated from the Disney Parks segment was up 13% (y/y) to $8.3B (mainly boosted by gains in international parks, which offset a slowdown in attendance and hotel room purchases in domestic parks). This also brings about its segment operating income being up 11% (y/y) to $2.4B.
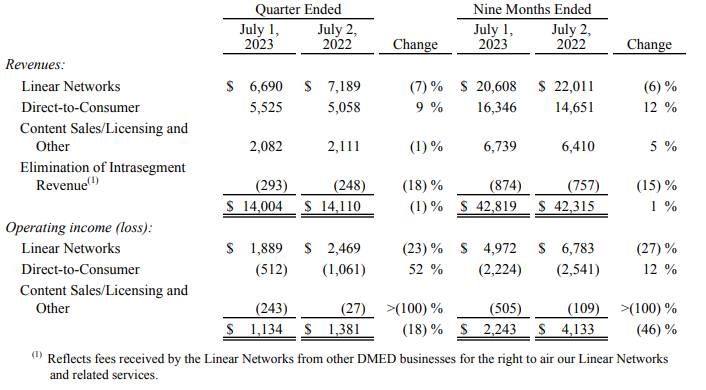
On the contrary, the company’s Media and Entertainment Distribution was down -1% (y/y) in revenue to $14.0B. Both domestic and international channels reported losses, leading to Linear Networks being down -7% (y/y) to $6.7B. Operating income for the segment was also down -23% (y/y) to $1.9B. Revenue for Content Sales/Licensing and Other was also down -1% (y/y) to $2.08B.The losses of the two segments were offset by gains in Direct-to-Consumer segment, which was up 9% (y/y) to $5.5B. Its operating losses narrowed to -$0.5B (was -$1.1B in the same period last year), following reduced losses at Disney+ and ESPN+, as well as higher operating income at Hulu.
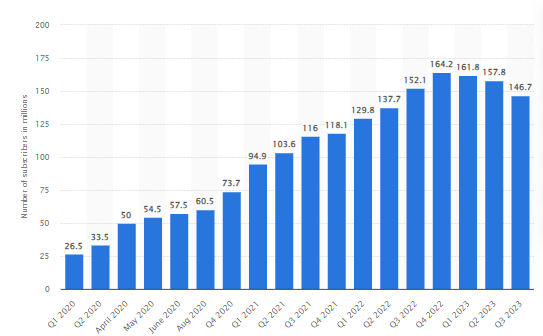 Disney Plus Subscribers. Source: Statista
The company reported a drop in global Disney+ subscribers for the third time consecutively, to 146.7 million (was 157.8 million in Q2 2023, and 152.1 million in Q3 2022). The majority of the subscriber losses were from the Indian brand Disney+ Hotstar (-24%), whereas domestic subscription dropped only -1%. This has resulted in streaming revenue losses of -$512 million (was -659 million in Q2 and -$1.1B in Q1), despite the company’s effort in slashing its costs up to $5.5B.
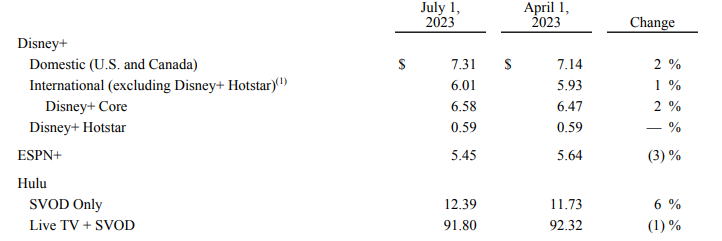
Average Monthly Revenue Per Paid Subscribers for DTC Products. Source: Walt Disney
Several measures have been announced by the management to combat dwindling users and falling revenue, which include a price hike on the ad-free streaming tier and a password sharing crackdown. Last month, Netflix reported a boost in subscriber growth which far exceeded market expectation. Could the same strategies work the magic as well for Disney channels?
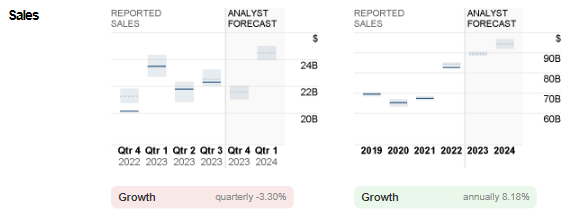
Consensus estimates for sales revenue in the upcoming announcement stood at $21.6B, down slightly over -3% from previous quarter, and up 7.5% from prior year ago. If expectations are met, this would account for total sales revenue at $89.5B for FY 2023, up over 8% from FY 2022.
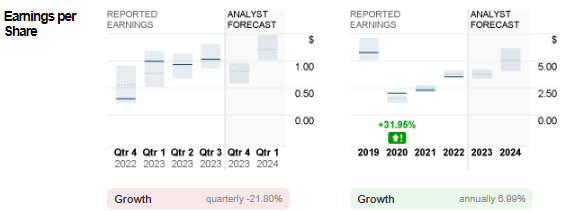
On the other hand, EPS is expected to be down over -20% from the previous quarter, to $0.81. In Q4 2022, it was only $0.30. Forecast for final EPS in 2023 would remain flat at $3.78 (was $3.53 in previous year).
Technical Analysis:
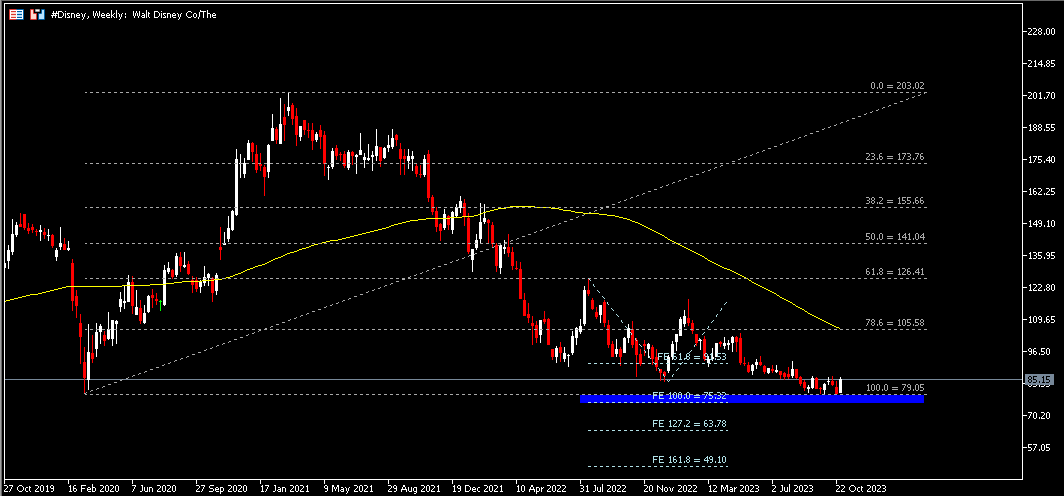
The #Disney share price recently closed above its 3.5-year low ($79.05). Overall trend direction remains bearish (below 100-weekly SMA), with ATH seen at $203.02 in March 2021. The 3.5-year low together with $75.30 form the nearest support zone, followed by $63.80. On the contrary, $91.50 serves as a minor resistance. A break above may encourage more technical rebound, towards the 100-week dynamic resistance, which intersects with FR 78.6% at $105.60.
Click here to access our Economic Calendar
Larince Zhang
Market Analyst
Disclaimer: This material is provided as a general marketing communication for information purposes only and does not constitute an independent investment research. Nothing in this communication contains, or should be considered as containing, an investment advice or an investment recommendation or a solicitation for the purpose of buying or selling of any financial instrument. All information provided is gathered from reputable sources and any information containing an indication of past performance is not a guarantee or reliable indicator of future performance. Users acknowledge that any investment in Leveraged Products is characterized by a certain degree of uncertainty and that any investment of this nature involves a high level of risk for which the users are solely responsible and liable. We assume no liability for any loss arising from any investment made based on the information provided in this communication. This communication must not be reproduced or further distributed without our prior written permission.


