


Pfizer, is the largest pharmaceutical company in the world (rankingthebrands.com), and was founded in 1849. The company shares are listed on the NYSE and are a component of Dow Jones Industrial Average (USA30) as well. This American multinational pharmaceutical corporation, which is based in New York City and the UK’s GlaxoSmithKline(GSK) on Wednesday 19, December 2018, announced a merger of their consumer healthcare units that produce over-the-counter medicines.
Pfizer, Inc. PFE (NYSE), will report the Q3 earnings results for 2019, on October 29, before the US market opens. Before going to Q3 data estimates, we will examine some more data from the company and its products to have a better understanding of estimated numbers.
After a small beginning, the company grew quickly both organically and through a number of key mergers and acquisitions to become the world’s number one pharmaceutical company. Most known products includepneumonia vaccine Prevnar, Lyrica, Dimetapp, Xanax and Viagra, which treats erectile dysfunction. However, as we can see in Company documents and the report of “axios.com”, “Over the past 4 years, the product that generated the most sales for Pfizer wasn’t one of its household names, like Lyrica, Lipitor or Viagra. It was Prevnar 13, a vaccine that protects against pneumonia and other infections.”

Previous quarters overview:
So far, Pfizer’s shares have declined 15.78% YTD, based on Zacks’ data, compared to a decline of 0.3% for the industry. (Zacks)

The following information and data about the first and second quarter of 2019 has been taken from the company report. (investors.pfizer.com)
During first-quarter 2019, Pfizer returned $10.9 billion directly to shareholders, through a combination of:

Second-Quarter 2019 Revenues of $13.3 Billion, Reflecting 2% Operational Growth Driven by 6% Operational Growth from Pfizer Biopharmaceuticals Group
Second-Quarter 2019 Reported Diluted EPS of $0.89, Adjusted Diluted EPS of $0.80
Updated 2019 Financial Guidance Primarily to Reflect the Anticipated August 1, 2019 Formation of the Consumer Healthcare Joint Venture with GlaxoSmithKline plc and the Anticipated Near-Term Completion of the Array BioPharma Inc. Acquisition
Announces Reverse Morris Trust Transaction to Combine Upjohn and Mylan, Creating a New Global Pharmaceutical CompanyI
The Zacks Consensus Estimate for Q3 is: I
Meanwhile, due to some unfavourable revisions in Advisory Committee on Immunization Practices’ (ACIP) pneumococcal vaccination guidelines for Prevnar 13 in adults across the United States, Pfizer, had said that it expects some decline in demand for Prevnar, which could weaken sales in the future quarters.
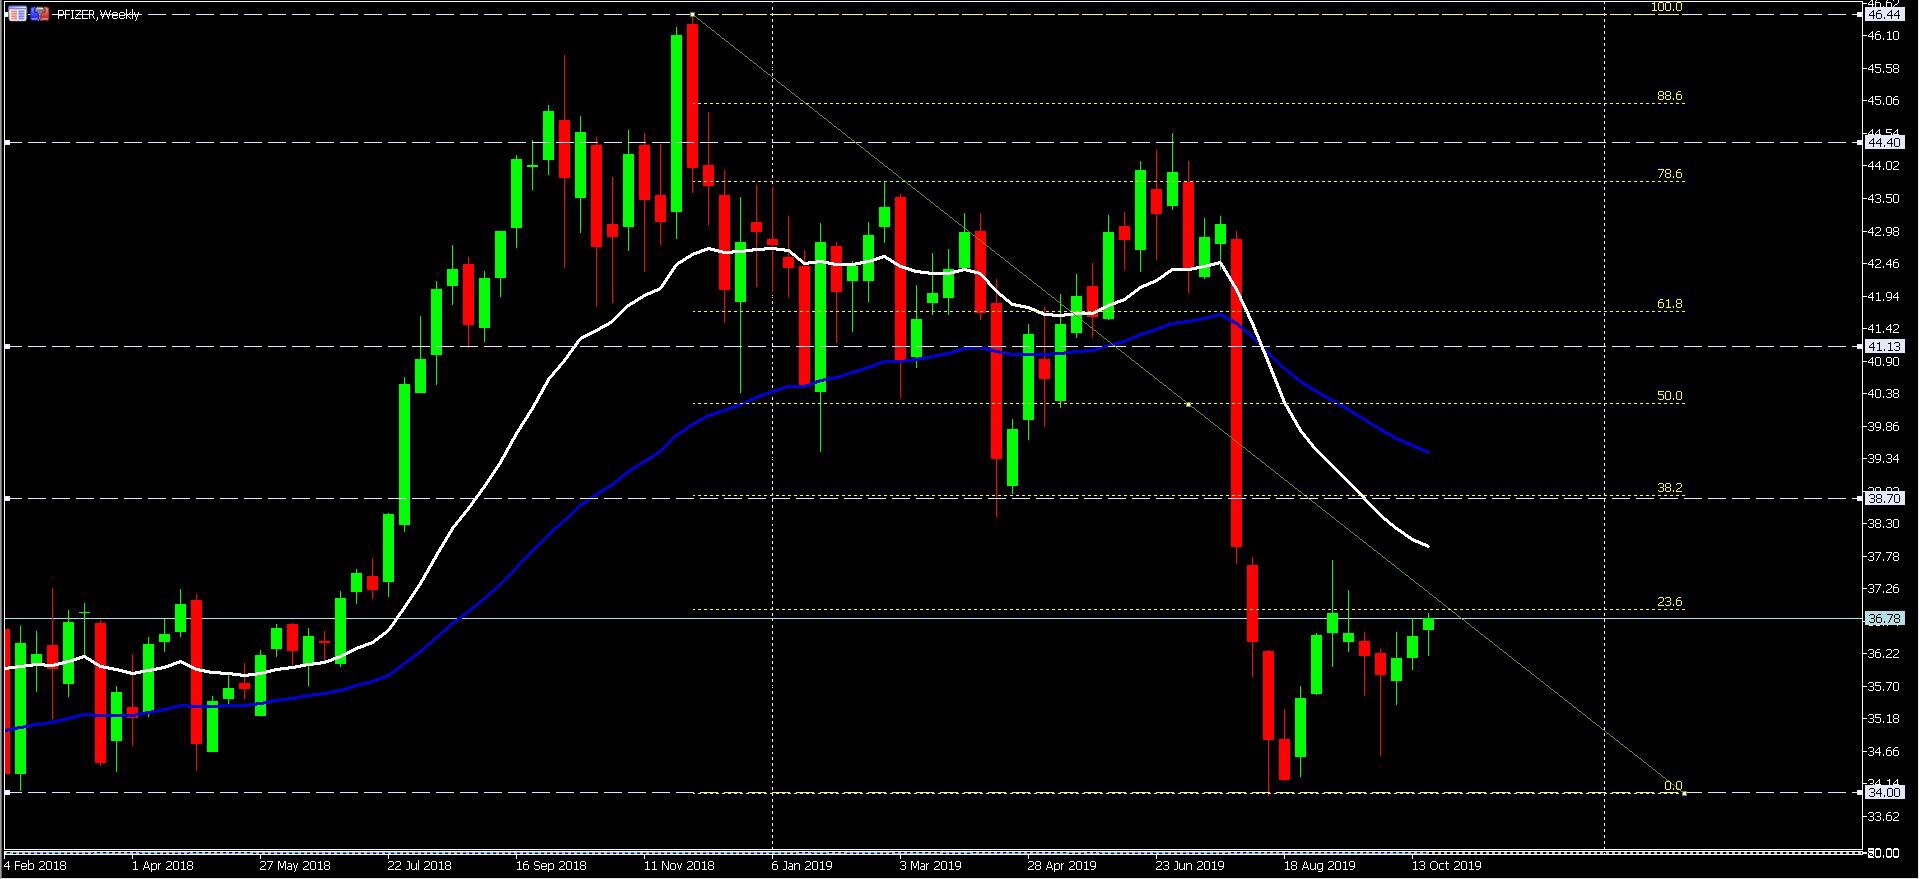
Technical overview:
|
S1 |
S2 |
S3 |
R1 |
R2 |
R3 |
|
34.00 |
31.52 |
28.92 |
38.75 |
41.71 |
43.77 |
Currently, the stock price has moved almost to its 23.6% Fibonacci, falling from its HH in $46.44 (December 2018) to its 18 months low at $34.00 (Aug. 2019). Technically, it is in a downtrend in the higher timeframes, moving under EMA50 as well as EMA20. However, in the H1 and H4 chart, candles are clearly forming above EMA20 and 50 with the confirmation of the bullish trend from EMA crossing strategy. Key levels, for now, provide support and resistance levels, which one by one will be in focus, depending on positive or negative earnings reports. However, since August and its LL, it could hardly reach it’s 23.6% Fibo once, and now it is trading under this level, testing the 38.2% fibo would be the next resistance levels. A pullback from these fib levels and a break of S1 at $34.00, will put the trend back in its bearish way to test its 26 months low at $31.52 and S3 at $28.92.
Click here to access the Economic Calendar
Ahura Chalki
Regional Market Analyst
Disclaimer: This material is provided as a general marketing communication for information purposes only and does not constitute an independent investment research. Nothing in this communication contains, or should be considered as containing, an investment advice or an investment recommendation or a solicitation for the purpose of buying or selling of any financial instrument. All information provided is gathered from reputable sources and any information containing an indication of past performance is not a guarantee or reliable indicator of future performance. Users acknowledge that any investment in Leveraged Products is characterized by a certain degree of uncertainty and that any investment of this nature involves a high level of risk for which the users are solely responsible and liable. We assume no liability for any loss arising from any investment made based on the information provided in this communication. This communication must not be reproduced or further distributed without our prior written permission.


